
Highlights
Food Surveys Research Group
Dietary Data Brief No.
U.S. DEPARTMENT OF AGRICULTURE
Agricultural Research Service
Beltsville Human Nutrition Research Center
Food Surveys Research Group
www.ars.usda.gov/ba/bhnrc/fsrg
13
• The average daily dietary
calcium intake is 1029 mg.
• The diets of females have a
higher calcium density
compared to males.
• A quarter of Americans report
taking a dietary supplement
containing calcium.
• Dietary calcium intake of the
population has shown an
increasing trend from the mid-
90s, increasing approximately
85 to 190 mg across age
groups.
• The top three WWEIA Food
Categories that contribute to
calcium intake are Milk and
dairy, Mixed dishes, and
Grains
September 2014
Calcium intake of the U.S.
population
What We Eat in America, NHANES 2009-2010
Calcium, the most abundant mineral in the body, is required for many important
functions. About 99% of the body’s calcium is found in bones and teeth, where it
is essential for formation and maintenance of strong bones and teeth. The
remaining 1% of calcium is found in the blood, muscle and other tissues, and has
important roles in blood clotting, muscle function, nerve transmission, and blood
pressure. Calcium has been identified as a nutrient of concern in the 2010
Dietary Guidelines for Americans (1). Data from What We Eat In America,
NHANES 2009-2010 indicated that 42% of Americans did not meet their
Estimated Average Requirements for calcium as recommended by the Institute
of Medicine (2). This report presents data on the dietary and supplemental
calcium intake of the U.S. population as reported in What We Eat In America,
NHANES 2009-2010 and the contribution of foods and beverages to calcium
intake.
The mean daily intake of dietary calcium for individuals 2 years and older was
1029 mg. As Figure 1 shows, intake of males was significantly higher than
females for teens and adults up to 60 years of age. For those older adults,
intake was significantly lower than all others combined within gender.
What is the calcium intake of the U.S. population?
Figure 1. Calcium intake of U.S. population, WWEIA, NHANES 2009-2010
1150
1034
1127
1260
1210
1188
966
913
1030
963
948
947
882
842
0
500
1000
1500
All
2-5
6-11
12-19
20-39
40-59
60+
Age (years)
Males
Females
*
*
+
+
Calcium (mg)
*
Significantly different from females (p<0.001)
Within gender, significantly different than other age groups combined (P<0.001)
SOURCE: What We Eat in America, NHANES 2009-2010, day 1, individuals 2+ years
*
M. Katherine Hoy, EdD, RD and Joseph D. Goldman, MA
*
+

FSRG Dietary Data Brief -- No.
13 – September 2014
Calcium intake is influenced by energy intake.
Figure 2. Calcium density (mg/1000 kcal) of U.S. population, WWEIA, NHANES 2009-2010
The higher calcium intake of males is related to their higher energy intakes. When calcium intake is
adjusted by energy intake, the diets of females have a higher calcium density (mg calcium/1000 kcal) than
males, as shown in Figure 2. When all females are considered together, this difference is significant,
although differences between males and females by age group were only significant for those 20-39 years.
Difference in calcium density may be related to food choice.
494
680
587
509
458
470
473
530
682
533
528
518
515
531
0
100
200
300
400
500
600
700
800
All
2-5
6-11
12-19
20-39
40-59
60+
Males
Females
*
*
Age (years)
*Significantly different from males (p<0.001)
SOURCE: What We Eat in America, NHANES 2009-2010, day 1, individuals 2+ years
Calcium (mg)

FSRG Dietary Data Brief -- No.
13 -- September 2014
Does calcium intake differ by race/ethnicity and income status?
Figure 3. Calcium intake of U.S. population, by race/ethnicity and income, WWEIA, NHANES 2009-2010
-2-
1079
977
865
996
992
1078
0
500
1000
1500
b
Non-
Hispanic
Black
Hispanic
Low
Middle
High
Race/ethnicity
Income
‡
b
a
a
Calcium (mg)
a
a,b
Within race/ethnicity and income, significantly different (p<0.001)
‡
Income level based on % poverty threshold – Low: 0-130%; Middle: 131-300%; High: >300%
SOURCE: What We Eat in America, NHANES 2009-2010, day 1, individuals 2+ years
Non-
Hispanic
White
Yes. There are some differences in calcium intakes by race/ethnicity and income status. As Figure 3
shows, mean intake of Non-Hispanic blacks was lower than Non-Hispanic whites and Hispanics. Figure 3
also shows that when considered by income status, those from lower income households had lower intakes
compared with those from the highest income households. Differences in calcium density by
race/ethnicity and income status are similar to those for intake.

FSRG Dietary Data Brief -- No.
13 – September, 2014
Yes. As Figure 4 illustrates, trends in calcium density, excluding calcium that may be obtained from
drinking water, show significant increases since the mid to late 1990s. Across age categories, the
increases ranged from around 70 to 130 mg per 1000 kcal. These increases in calcium density resulted in
similar trends for total calcium intake, which increased around 85 to 190 mg across age categories (data
not shown).
Has calcium intake changed over time?
Figure 4. Trends in calcium density between 1994-1998 and 2009-2010
-3-
538
483
415
376
375
413
667
546
489
449
457
477
0
500
1000
2-5
6-11
12-19
20-39
40-59
60 and over
Calcium (mg)
Age (years)
1994-1998
1999-2000
2001-2002
2003-2004
2005-2006
2007-2008
2009-2010
*
*
*
*
*
*
Significant linear trend for increasing calcium density between 1994-1998 and 2009-2010 P<0.001
SOURCE: What We Eat in America, NHANES 2009-2010, day 1, individuals 2+ years
*
FSRG Dietary Data Brief -- No.
13 – September 2014
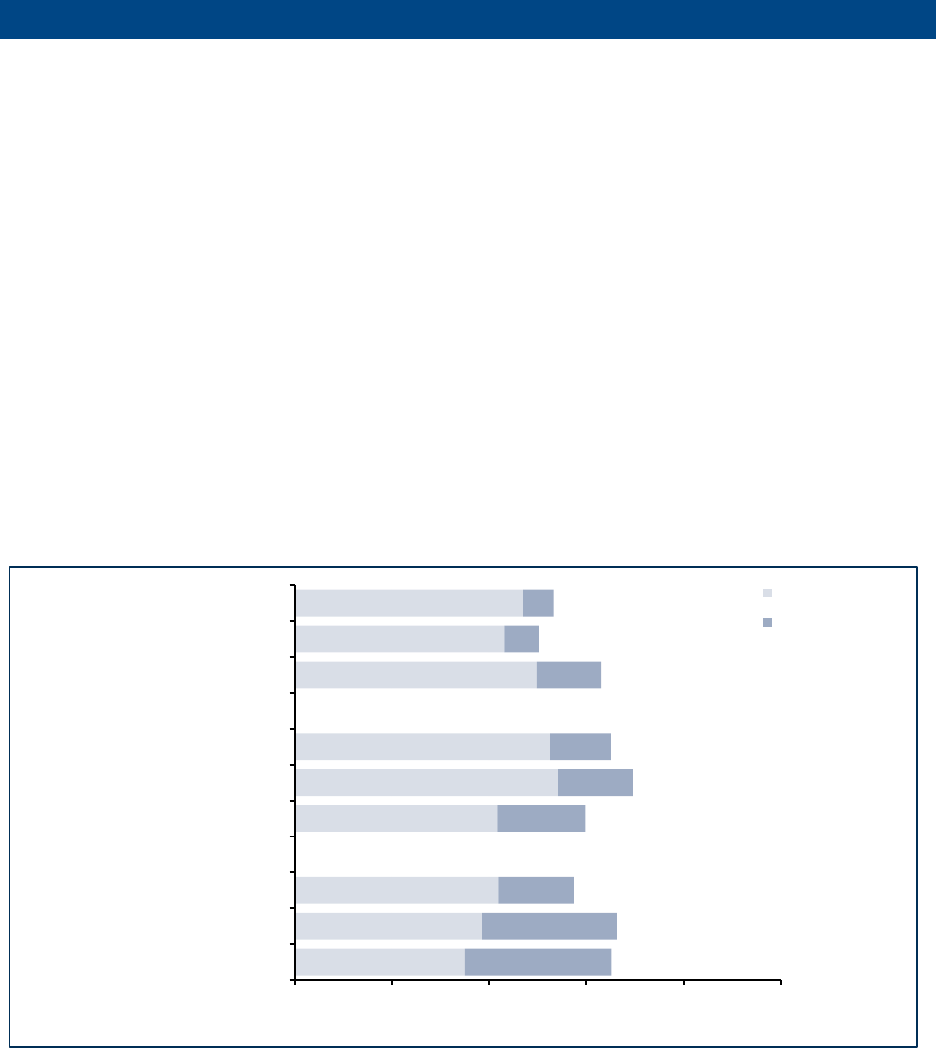
Approximately one-quarter (26%) of individuals 2 years and older (excluding pregnant and/or lactating
women, and breast-fed children) reported taking a multi- or single ingredient supplement containing
calcium on a given day (3). Compared to males, a higher percentage of females over 20 years and older
reported supplement intake (26% versus 37%) (3). The average intake of calcium from multi- or single
ingredient supplements was 521 mg (3). As Figure 5 illustrates, females taking supplements containing
calcium consume higher amounts of supplemental calcium compared to their male counterparts, and
males and females 60 years and older who take supplements containing calcium consume more
supplemental calcium than younger individuals
What is the contribution of supplements to calcium intake?
Figure 5. Contribution of diet and supplements to total calcium intake of those who report taking a supplement on
a given day, WWEIA, NHANES 2009-2010
-4-
875
964
1048
1043
1355
1313
1245
1079
1175
754
692
387
452
384
312
330
177
156
0 500 1000 1500 2000 2500
60+
40-59
20-39
60+
40-59
20-39
12-19
6-11
2-5
Diet
Supplements
1331
1256
1575
1435
1656
1629
1625
1739
1495
Males
Females
SOURCE: What We Eat in America, NHANES 2009-2010, day 1, individuals 2+ years
Reporters of calcium-containing supplements only (n=1,883)
Age (years)
Males and
Females
Calcium (mg)

FSRG Dietary Data Brief -- No.
13 -- September 2014
Table 1 shows the contribution of WWEIA food categories to calcium intake of the population. Milk and
dairy products contributed over one-third (37%) to total calcium intake, of which about half (19%) was
from plain milk. This included milk consumed as a beverage, added to cereal, or added to another
beverage. About one-third of the contribution from milk and dairy was from cheese. Mixed dishes
accounted for 17% of calcium intake, which included cheese in pizza, sandwiches (primarily from fast
food) and mixed ingredient items such as tacos, burritos, pasta dishes, and macaroni and cheese. Grains,
primarily grain products, provided 12% of calcium, over half of which was from breads, rolls and tortillas
(7%).
What foods contribute to calcium intake of the population?
Table 1. Contribution of What We Eat In America Food Categories to calcium intake of U.S. population, WWEIA, NHANES,
2009-2010.
-5-
†
Food categories not listed contribute 3% or less to calcium intake of the population, including Fruit, Fats and oils, Condiments and sauces,
Sugars, and Alcoholic beverages.
ǂ
Percentage of individuals reporting the foods in the category at least once on the reporting day.
SOURCE: What We Eat in America, NHANES 2009-2010, day 1, individuals 2+ years
Food Category
+
Individuals
Reporting
(%)
ǂ
Contribution
to calcium
intake (%)
Milk and dairy
73 37
Milk: whole, reduced, low and non-fat milk
Flavored milk: chocolate and other flavored milk
Cheese: cheese and cottage/ricotta cheese
Yogurt: plain and flavored yogurt
48
7
39
8
19
3
13
2
Mixed dishes 68 17
Grain-based: pasta dishes, macaroni and cheese, burritos, tacos, tamales, fried rice
Pizza: fast food/restaurant and frozen pizza
33
14
6
5
Grains 85 12
Breads, rolls, tortillas: yeast breads/rolls, flour and corn tortillas, bagels, English muffins
66 7
Non-alcoholic beverages, excluding plain and flavored milk 90 8
100% juice: citrus juice, other fruit and vegetable juices
25 4
Snacks and sweets: ice cream, frozen dairy products, candy containing chocolate,
cakes and pies, tortilla/corn chips
80 7
Protein foods
: meats, poultry, seafood, cured meats, plant-based protein foods 82 5
Vegetables:
potatoes, dark green vegetables, lettuce and salads, other vegetables 67 4

FSRG Dietary Data Brief -- No.
13-- September 2014
Definitions
Estimates in this report are based on one day of dietary intake data collected in What We Eat in America,
the dietary intake interview component of the National Health and Nutrition Examination Survey
(NHANES) in 2009-2010. Data on calcium consumption and contribution of foods to dietary calcium
intake are based on Day 1 dietary intake data of 9042 individuals age 2 years and older with complete and
reliable intakes, excluding breastfed infants. Sample weights were applied in all analyses to produce
nationally representative estimates.
Data source
1. U.S. Department of Agriculture and U.S. Department of Health and Human Services. Dietary
Guidelines for Americans, 2010. 7
th
Edition, Washington, DC: U.S. Government Printing Office,
December, 2010
2. Moshfegh, A. The State of the American Diet. http://www.health.gov/dietaryguidelines/2015-
binder/2015/docs/fedPresentations/stateOfTheAmericanDiet_Moshfegh.pdf, Accessed 07-12-13
3. U.S. Department of Agriculture, Agricultural Research Service. 2012. Total Nutrient Intakes: Percent
Reporting and Mean Amounts of Selected Vitamins and Minerals from Food and Dietary
Supplements, by Gender and Age, What We Eat in America, NHANES 2009-2010. Available:
www.ars.usda.gov/ba/bhnrc/fsrg
4. National Research Council. Dietary Reference Intakes for Calcium and Vitamin D. Washington,
DC: The National Academies Press, 2011
References
-6-
Estimated Average Requirement (EAR) : the nutrient intake value that is estimated to meet the
requirement defined by a specified indicator of adequacy in 50 percent of the individuals in a life
stage and gender group (4).
calcium density: The amount of calcium in a specified amount of a food or diet in order to make
comparisons. Comparisons of the calcium density of foods are usually on a per 100 gram basis, and
comparisons of the calcium density of the diet are usually on a per 1000 kcal basis.

www.ars.usda.gov/ba/bhnrc/fsrg
The U.S. Department of Agriculture (USDA) prohibits discrimination in all its programs and activities on the basis of race, color, national origin,
age, disability, and where applicable, sex, marital status, familial status, parental status, religion, sexual orientation, genetic information, political
beliefs, reprisal, or because all or part of an individual's income is derived from any public assistance program. (Not all prohibited bases apply to
all programs.) Persons with disabilities who require alternative means for communication of program information (Braille, large print, audiotape,
etc.) should contact USDA's TARGET Center at (202) 720-2600 (voice and TDD). To file a complaint of discrimination, write to USDA,
Director, Office of Civil Rights, 1400 Independence Avenue, S.W., Washington, D.C. 20250-9410, or call (800) 795-3272 (voice) or (202) 720-
6382 (TDD). USDA is an equal opportunity provider and employer.
FSRG Dietary Data Brief -- No.
U.S. DEPARTMENT OF AGRICULTURE
Agricultural Research Service
Beltsville Human Nutrition Research Center
Food Surveys Research Group
www.ars.usda.gov/ba/bhnrc/fsrg
All material appearing in this report is in the public domain and may be reproduced or copied without
permission. However, citation as to source is appreciated.
Copyright information
13 -- September 2014
Hoy MK, Goldman JD. Calcium intake of the U.S. population: What We Eat in America, NHANES 2009-
2010. Food Surveys Research Group Dietary Data Brief No. 13. September 2014.
Suggested citation
M. Katherine Hoy and Joseph D. Goldman are with the Food Surveys Research Group, Beltsville Human
Nutrition Research Center, Agricultural Research Service, U.S. Department of Agriculture.
About the authors
