
SDP FELLOWSHIP CAPSTONE REPORT
Scaling Barriers to Ensure Success in Program
Evaluation
Clint Sattler, Knox County Schools
Rob Sayre, Fayette County Public Schools
Daphne Jenkins, Fayette County Public Schools
Eric Moore, Minneapolis Public Schools
Jonathan Doll, Michigan Department of Education
SDP Cohort 5 Fellows
SCALING BARRIERS TO ENSURE SUCCESS IN PROGRAM EVALUATION
1
Strategic Data Project (SDP) Fellowship Capstone Reports
SDP Fellows compose capstone reports to reflect the work that they led in their education
agencies during the two-year program. The reports demonstrate both the impact fellows make
and the role of SDP in supporting their growth as data strategists. Additionally, they provide
recommendations to their host agency and will serve as guides to other agencies, future
fellows, and researchers seeking to do similar work. The views or opinions expressed in this
report are those of the authors and do not necessarily reflect the views or position of the Center
for Education Policy Research at Harvard University.
SCALING BARRIERS TO ENSURE SUCCESS IN PROGRAM EVALUATION
2
Framing the Problem
Within the context of continuously improving schools, school systems, and educational
state agencies, the subject of program evaluation is not only essential, but in a growing number
of places is a required component of educational practice. Even with this requirement, there
are a myriad of benefits to conducting program evaluations with fidelity. Among these are that
data can be used to test and refine educational processes and better reach the students
involved. Also, systems can be more cohesive and coherent so as to better use, rather than
monopolize, the available resources of an education entity. The key question, however, that
our workgroup wrestled with was how to formulate a model for conducting effective program
evaluations while each member was at a different stage in the process. In so doing, we wanted
to plot a path that was not necessarily sequential, but rather that addressed research-based
milestones to aim for during any program evaluation.
Overall, while the results that come from effective program evaluations can be used to
help adapt, refocus, or change programs delivered to students, there are also costs involved.
With this in mind, and that funds in districts and states are not limitless, we aim herein to bring
enlightenment to the program evaluation process in ways that can streamline the usage of
funds while also not necessarily introducing many new costs. Some program evaluations may
result in recommending that an important program is overhauled, and so in the short term this
means that workloads will be increased. However, the fruit of effective program evaluations
over time is that an educational entity can be better focused in the delivery of education to its
students.
In the following literature review and subsequent examinations of four program
evaluations in three districts and one state agency, we consider at depth the benefits of
conducting program evaluations in education and how to best focus our research to reach the
students that are often the direct recipients of the programs being evaluated. In this context,
we want to recognize that the single most fundamental reason for conducting program
evaluations in education is to improve educational outcomes for students—even if this causes

SCALING BARRIERS TO ENSURE SUCCESS IN PROGRAM EVALUATION
3
some unsettling in place where people are comfortable with ineffective systems. As Winston
Churchill famously said, “To improve is to change; to be perfect is to change often.
1
”
Literature Review
Thus, as SDP Fellows across four Eastern/Midwestern states, we set about to gain a
better appreciation of national standards for program evaluation as set out by the Joint
Committee on Standards for Educational Evaluation. These program evaluation standards, first
crafted in the 1970s, aimed to bring consistency and utility to a field of program evaluation
research. It is noted that at the time standards were created, educational research was
reflected by inconsistency and differing quality with regard to results.
2
One overarching goal
from the comprehensive standards statements was to provide a sense of common ground for
educational researchers and in turn for their findings. This insight resonated with each of the
SDP Fellows as they embarked separately on projects which ultimately were leading towards
the same goal: improving the outcomes of students. The four projects dealt with:
• Understanding early literacy summer programs,
• Return on investment analyses of human capital in education,
• Focus groups in analyzing program effectiveness across schools, and
• Learning efficacy of grant-recipient schools in making sustainable school
improvement.
To start with, however, it is important to consider the basic elements of the improvement cycle
in education as described by Bernhardt (2004)
3
and depicted in Figure 1. This in turn will show
how to engage a program evaluation that will be able to support a school’s improvement. Each
of these steps will lead towards academic improvement, which necessarily is measured by
improvements in achievements and by supporting adult refinements as well.
1
Churchill, W. (1925, June 23). House of Commons. Retrieved from: https://www.winstonchurchill.org.
2
Degracie, J. & Merrill, B. (1994). Implications of using the revised program evaluation standards in local education
agencies. Journal of Experimental Education, 63(1).
3
Bernhardt, V. (2004). Data analysis for continuous school improvement. NY: Routledge.

SCALING BARRIERS TO ENSURE SUCCESS IN PROGRAM EVALUATION
4
Figure 1. Graphical Depiction of Continuous Improvement Cycle (Bernhardt, 2004)
Program Evaluations that support continuous improvement
For each of us, coming from different perspectives within our own educational agencies,
the aims of our respective agencies and the place we are within a team working in program
evaluation may differ in either the locus of effort or attainment of results. Still, however, in our
collective work in program evaluation, we share the goal of continuous school improvement. In
this recursive cycle, a researcher can adopt the previously set Program Evaluation Standards as
their vision, while also maintaining any agency-specific values or beliefs that can add further
clarity to the research project.
Within this context, the first step is to plan the program evaluation. Planning involves
identifying the problem and potential reasons for this problem. By accurately understanding
and defining an educational problem, the process is set in place to develop a robust program
evaluation which in turn will lead to solutions. The planning process also involves developing
SCALING BARRIERS TO ENSURE SUCCESS IN PROGRAM EVALUATION
5
rationale and concrete methodology for getting to a better place, the envisioned place that fully
aligns with the agency’s vision and mission regarding the research project.
The next step is to implement the program evaluation. This step in the cycle begins with
thoroughly applying each statement from the five standards listed in the Program Evaluation
Standards. This thorough investigation will provide better clarity of the researched problem
while also testing the various means by which you can better understand the problem at hand.
As each of the five standards is better clarified and the problem understood, evaluation can
occur that will lead towards either adapting the program at hand or realizing that larger change
is needed to make the program more useful. In some cases, the problems and responses
required may not be as clearly defined, and so the researcher needs to determine the most
equitable path forward for the agency in relation to the research project.
As a result, the researcher is then able to evaluate the program initially being studied.
As SDP Fellows, this step involved a two-year process in order to reach the completion point of
evaluating our respective research projects. Other program evaluations may take less time
while still others may involve far more time. As such, it is important for the research to set clear
expectations about which outcomes can be expected after certain periods of time (i.e., short-
or long-term outcomes) and then to provide the right level of organizational momentum to
ensure that externally imposed evaluation timelines do not interfere with the desired outcomes
we are trying to achieve.
With this in mind, it is the evaluation phase where the individual purpose of the project
can be realized and then best practices can be discerned as an effective agency response. Once
the evaluation process is completed, sustainable improvement in student achievement can be
realized, by implementing these best practices. With that in mind, the overall goal of program
evaluation is to foster continuous school improvement and identifiable improvements in
student achievement.
Continually, the work of an effective program evaluation should be purposefully
understood within the context of the previous three steps—planning, implementing, and
evaluating a program evaluation. An example of a program evaluation of a relatively shorter
term was Auburn University’s analysis of their need to improve their masters-level K–12

SCALING BARRIERS TO ENSURE SUCCESS IN PROGRAM EVALUATION
6
education leadership program (Ross, 2010).
4
A key benefit of their research was to breakdown
some of the implementation steps to include context evaluation (fully understanding the
interrelationships of many key stakeholders) and process evaluation (analyzing the potential
organizational steps for change to insure they will not impede the improvement process). A
lengthier program evaluation is the work of Allen, Ammon, Breshears, Drace, Husemen, Jensen,
and Orcutt (2014).
5
They analyze the potential benefits and costs of higher education’s
responsibility to teach about the Common Core State Standards in Missouri. While their
research is still in process, and many other states are weighing on similar programs, the
potential long-term benefits of a robust, clear and replicable program evaluation are clear and
such research is able to assist research in other states.
Using a Framework of Broadly Accepted Program Evaluation Standards
Overall, while the steps and mechanics inherent to conducting a robust and effective
program evaluation can be straightforward, there are often barriers to reaching the goal of
continuous improvement. Awareness of common challenges in program evaluation, and having
strategies to meet these challenges head-on, will create a more effective program evaluation,
streamline the use of resources in evaluation, and aid in stakeholder engagement through all
steps of the evaluative process.
As experienced data analysts, we generally consider our most pressing concerns to
revolve around sampling, data collection and integrity. Professional judgment, available
resources and available partnerships all influence the types and quality of data that can be used
for the evaluation (Bernhardt 2004)
6
. Oftentimes, evaluations are assigned on an ad-hoc basis,
and the advanced planning that is required to secure these data sources and partnerships is not
feasible. Thus, adherence to the Program Evaluation Standards (notably the feasibility and
4
Ross, M. (2010). Designing and using program evaluation as a tool for reform. Journal of Research on Leadership
Education, 5(12.7).
5
Allen, T., Ammon, S., Breshears, A., Drace, B., Husemen, J., Jensen, D., & Orcutt, V. (2014). Common Core State
Standards (CCSS) – Higher education’s role in developing education professionals: An evaluation of the network for
instructional support and enhancement (NISE) program at the University of Central Missouri. Retrieved from:
http://educationalrenaissance.org/index.php/edren/article/download/70/pdf
5
Fitzpatrick, J., Sanders, J. Worthen, B. (2011), Program Evaluation: Alternative Approaches and Practical
Guidelines, 4
th
Ed, Pearson.
6
Ibid., Bernhardt, V. (2004).
SCALING BARRIERS TO ENSURE SUCCESS IN PROGRAM EVALUATION
7
evaluation accountability standards) can alleviate most of these concerns. This provides
industry-best standards that help ensure quality, and ultimately the creation of defendable
output.
Before each of us goes deeper in explaining the projects that we have engaged in, it is
important to focus on the program evaluation standards and discuss some critical connections
made by them. The standards statements are listed in Appendix A as organized under five
domains.
Of the eight utility standards, there is an emphasis on connections that a researcher will
make with the researched field, with stakeholders, with equitable processes, and with the
results being used in ways that are beneficial. In total, these first eight standards harken to the
origins of research and the Hippocratic Oath to ‘do no harm.’
Regarding the four feasibility standards, the common theme is of efficiency for the
researcher and ways that the overall project can be managed that ultimately maximize the
potential results. Increasing the potential productivity of the researcher is vital given that
resources are sometimes depleted in education and research projects may soar in number.
The seven propriety standards stress the need for responsibility on the part of the
researcher, not only in equitable results to stakeholders, but also clarity in findings and fairness
applied to those being researched. While an investigator may lean towards seeing this domain
of standards as similar to the previous ones, the challenge that remains is to apply these
insights and ensure that the educational entity is in full agreement with the research and
potential results.
The eight accuracy standards hold the keys to the research project’s overall validity of
context and reliability of quality in its findings. Attaining this high level of precision requires
comprehensive work before the project in planning and design as well as legitimate
connections to other research during the process of interpreting findings.
Finally, included in the three evaluation accountability standards is the sobering
message that program evaluation research is not intended to be conducted or stored in a
vacuum, but rather that the exhaustive processes contained within them are well-documented
and replicable as a result. This reminds us that the burden is on the researcher to not only avoid
making lengthy descriptive summations of the research project, but to also be of further benefit

SCALING BARRIERS TO ENSURE SUCCESS IN PROGRAM EVALUATION
8
to future researchers by making the research processes clear and, in turn, reusable for
additional projects.
Overall, it is the program evaluation standards that became the ties that bind us as
separate SDP Fellows. Using these standards and our individual agency experiences, we believe
our research has the potential to benefit all other practitioners in our respective fields.
Furthermore, a flexible and evolving methodology that uses practical guidelines (as
highlighted in Fitzpatrick et al.
7
) can ensure that future program evaluators arrive at sound
conclusions even in a volatile evaluative environment.
The challenges we face as evaluators are not limited to empirical data. Each member of
this team, to varying degrees, is also involved with the management and oversight of the
evaluative efforts of others. That said, the current gold standard for program evaluation is
generally considered to be mixed method analyses of random clinical trials. Conducting such
studies demands serious time and personnel commitments which may be impossible to realize
with today’s staffing formulas. Randomized clinical trials may also be undesirable because they
can become a linchpin for political wrangling, create their own ethical dilemmas, and
exacerbate existing divides within the programs under study (Goldstein Michael, 2012). Skillful
evaluators will select the proper evaluation model for different circumstances (Caracelli &
Greene 1993 and 1997
7
, Fitpatrick et al.
8
) while being cognizant of the costs involved. A list of
relevant models can be found in the table below (as adapted from Fitzpatrick et al., 2011).
7
Caracelli, V., Greene, J. (1993), Data Analysis Strategies for Mixed Method Evaluation Designs, Educational
Evaluation and Policy Analysis 15 (2); and Caracelli V., Greene, J. (1997), Crafting Mixed-Methods Evaluation
Designs, New Directions for Evaluation, 74.
8
Ibid., Fitzpatrick, et al (2011).

SCALING BARRIERS TO ENSURE SUCCESS IN PROGRAM EVALUATION
9
Table 1. Types of Evaluation Models
Model
Focus
Expertise-Oriented Providing professional judgments of quality
Consumer-Oriented Judging quality of products to aid purchases
Program-Oriented
Determining the extent to which program objectives or key
elements in program theory are achieved
Decision-Oriented Provide useful information to aid in making decisions
Participant-Oriented
Involving stakeholders to understand the complexity of
programmatic activity and empower the under-represented
As each of the five program evaluators in this report considered the five compelling
models listed in the previous table, we found that we borrowed important aspects from each
model. Thus, while we initially wanted to define a clear recipe for the program evaluation
process, this set of guides acted more as parameters within which to effectively conduct our
evaluations. The importance of this is that each program evaluator who follows one or more of
these models may find themselves using similar components and strategies in their work and
yet still be functioning at a different stage of completion.
Who are the stakeholders affected by the evaluation? What evidence will be most
compelling to the stakeholders involved in the analysis? What makes evidence compelling to
these stakeholders? What design methods are most feasible? What resources are available to
collect data? Answers to these questions will help determine the most effective type of
evaluation to conduct while also helping to do so in the most cost effective manner. It will also
help meet the requirements of any program evaluation, namely, quality, defendable and
actionable results stemming from responsible study of the issue.
The effects of a robust, effective program evaluation should not be underestimated.
Program evaluation can have a lasting effect on policy, with each policy having supporters and
detractors—classic examples include studies of Maimonides Rule and the Tennessee STAR
project regarding class sizes, orvarious studies regarding such diverse issues as school-vouchers

SCALING BARRIERS TO ENSURE SUCCESS IN PROGRAM EVALUATION
10
and need-based scholarship (Murnane & Willett, 2010
9
). Judgments expressed through
program evaluation can lead to shifts in allocated resources and perceived power. Each shift
will come with its own political implication and it is the responsibility of the evaluator to be
aware of the political landscape in which their judgments are made.
As researchers have identified, failure to acknowledge the political context in which an
evaluation will be conducted is detrimental to adoption of the evaluation conclusions (Datta
1999). As such, a quality evaluation will address the values of all stakeholders involved, yet
ultimately make a judgment that considers the public good. This approach is also espoused by
the Joint Committee on Standards for Educational Evaluation through the contextual validity
standard. The recommendations of Eleanor Chelimsky provide the backbone for reducing the
impact of political strife through a program analysis, and Fitzpatrick et al. (2011) build upon
these recommendations within the context the program evaluation standards (notably the
utility standards).
Operating efficiently within the political climate may still pose problems without an
ethical approach to evaluation. It is imperative for evaluators to function within the bounds of
clear ethical standards to foster acceptance of their ultimate judgments. Common ethical
dilemmas revolve around pre-evaluative biases, data integrity and confidentiality, stakeholder
pressure, and misuse of results (Shaw, Greene & Mark, 2006). The potential for misuse of
evaluation results within the context of the continuous improvement model in diagram 1
should not be underestimated. With increased accountability, “the evaluator can become the
‘hired gun’ of the manager and the program establishment” (Fitzpatrick et al). In essence, some
program managers blame the evaluator when unpopular decisions are made following the
dissemination of a program evaluation. Additionally, program administrators may feel pressure
to demonstrate program success and request judgments that are not supported by the data or
cite outcomes that are not tied to the theory of action of the program being evaluated. For
these reasons, adherence to the Program Evaluation standards is vital to ensure the goals of the
program evaluation are still met. Specifically, the propriety and accuracy standards from the
9
Murnane, R. & Willett, J. (2010). Methods matter: Improving causal inference in educational and social science
research, Oxford University Press, 2010. London: Oxford University Press.
SCALING BARRIERS TO ENSURE SUCCESS IN PROGRAM EVALUATION
11
Joint Committee on Standards for Educational Evaluation provide a framework for conducting
evaluations within the bounds of clear ethical behavior.
Reaching intended and emergent goals
All of the agencies involved in this capstone project have their own goals and objectives
related to program evaluations. In some cases, there are distinct areas of overlapping need
regarding program evaluation. Participating agencies are seeking to strengthen their own work
by applying best practices and fostering deeper understanding of the program evaluation
standards while exploring new ways to to implement those standards in their day-to-day work.
However, the application of these standards will vary greatly depending on the specific needs of
each agency. In what follows, each agency introduces the specific project that they undertook
during the Strategic Data Project Fellowship.
Fayette County Public Schools
In the summer of 2013, Fayette County Public Schools (FCPS) became involved with the
District Management Council in the Spending Money Smartly Initiative. Early on in this process,
it was evident that the data in FCPS was very isolated, and the capacity to utilize this data was
widespread and fragmented throughout the district. One of the essential goals of this project
was to become strategic with our resources and the way we allocate those resources. Strategic
resource allocation means funding what works, abandoning what doesn’t, and prioritizing cost
effective strategies. While few districts knowingly spend on ineffective or costly efforts, they
often unwittingly do. Three key steps to become more efficient and effective in allocating
resources are to:
• Develop in-house capability to perform program evaluations,
• Measure and monitor academic return on investment (A-ROI), and
• Weave program evaluation and A-ROI into the day-to-day fabric of how we
operate.
Developing in-house capability to measure and monitor A-ROI includes identifying staff
with the needed talent and skills, creating data collection systems, using multiple sources of
achievement data (annual state and district administered interim assessments), and ensuring
the availability of comprehensive cost data accumulated by program, not just line items, cutting
SCALING BARRIERS TO ENSURE SUCCESS IN PROGRAM EVALUATION
12
across all funding sources. FCPS already has much of the needed student achievement and cost
data, although it has not been used for this purpose.
As the Data Team is developed, the need for a formalized program evaluation and A-ROI
framework is critical to guide the work.
Knox County Schools
The Office of Accountability in Knox County has historically provided single, one-off
analyses as specific questions arose regarding programs and initiatives (and sometimes years
after kickoff of the initiative). Starting in 2012, the Office of Accountability began to partner
with other intra-district stakeholders to study the effectiveness of high dollar district
expenditures. KCS continued to build upon that foundation in 2014, releasing its Return on
Investment report which, for the first time, directly tied program evaluation to the KCS strategic
plan.
As the breadth and depth of KCS program analysis has evolved, it has become apparent
that its historically reactive posture to program evaluation is no longer practical. A demand has
arisen for a formalized framework to guide the current analytic work of the Office of
Accountability. KCS’s interest in this capstone project lies in providing a robust, rigorous, and
thoughtful evaluative process to better weld our previously fragmented studies into a unified
work. Our ultimate objective is to create a consistent framework (which will encompass the
entire life of a project) by which all strategic, high profile initiatives will be evaluated.
Minneapolis Public Schools
The Minneapolis Public School system elected to send the Director of Research and
Evaluation to participate in the Strategic Data Fellow Project in order to connect with
innovative researchers from across the country and improve the quality of work of the
Research, Evaluation and Assessment department. The department director has been charged
by district leadership to transform the department through aligning department work with the
district need of accelerating academic achievement of underperforming students. Specifically,
the superintendent has tasked the department director with redirecting department workflow
from 70% assessment to 70% program evaluation and data use. Currently all program
evaluation work has been aligned with high priority district initiatives. Department staff has
SCALING BARRIERS TO ENSURE SUCCESS IN PROGRAM EVALUATION
13
doubled since the last academic year. As demand for evaluation/data use has increased,
emerging challenges have become evident including how to meet the immediate needs of
schools and departments while also building a sustainable infrastructure that allows for
meaningful, rigorous, and ethical program evaluation and data use. The development of
coherent program evaluation and data use policies, guidelines, and tools have become
imperative.
Recent projects include program evaluations like a formative and summative
effectiveness study of focused instruction (a district process for teaching and learning), short-
term strategies (a study of the impact of autonomy through short term interventions across 13
schools), evaluating effectiveness of district magnet schools, development of longitudinal data
systems identifying supports and risk factor for African American students, and redesigning
existing data systems (dashboards that include longitudinal and daily academic and human
capital data) to empower district staff and teachers by making data more available, responsive,
and relevant to daily classroom practice.
Evidence of change include stronger collaborations across teaching and learning, human
capital, instructional technology and finance departments, the development of data
dashboards, the incorporation of non-cognitive measures into the district strategic plan, and
the inclusion of community, partner, and municipality student data (over 300 partners) into
district decision making processes. The Director has also been recently added to the
superintendent’s cabinet.
Michigan Department of Education/Michigan Department of Technology,
Management and Budget
While the Michigan Department of Education/Michigan Department of Technology,
Management and Budget has three SDP Fellows, only one researcher has chosen to conduct a
program evaluation. That said, that fellow conducted a two-year study of the efficacy of School
Improvement Grants (SIG) awarded to 28 low-performing Priority Schools in 2010. These
schools each received nearly $2 million dollars per year for each of the three years. Some
schools made significant improvements while others made less dramatic gains or even
remained stagnant.
SCALING BARRIERS TO ENSURE SUCCESS IN PROGRAM EVALUATION
14
With that in mind, the program evaluation of the efficacy of the SIG Grantee schools
includes four components:
• Measuring schools annually using the state’s Top-to-Bottom List,
• Evaluating a Survey of Sustainability completed by each of the SIG Grantee
schools that remained open through the two-year research period,
• Performing a site visit at each school and comparing/contrasting findings from
that visit with all other artifacts of the school’s improvement process, and
• Creating data analytics that could help schools deepen their improvements.
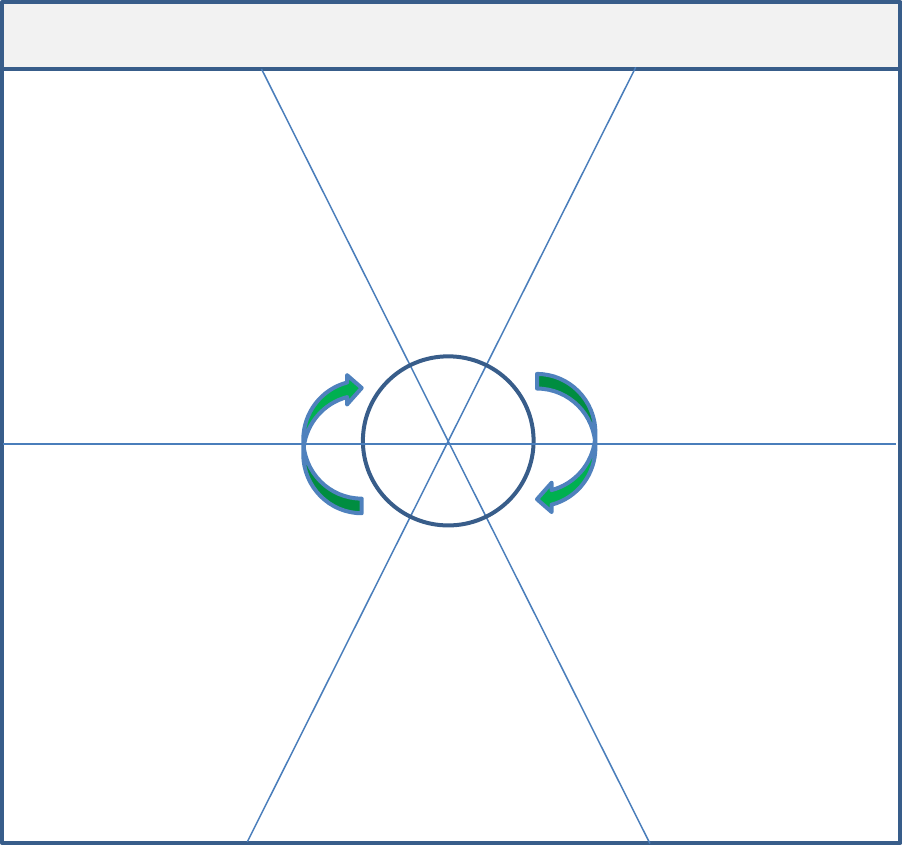
By understanding the work of each agency, an overall view of program evaluation can
be gained, as depicted in Figure 2. As stated initially in this paper, the program evaluation
process is not sequential, but rather, it is a cycle that can have more and more benefits as it is
repeated and deepened.
SCALING BARRIERS TO ENSURE SUCCESS IN PROGRAM EVALUATION
15
Figure 2. Components of Program Evaluation
As depicted in the figure, there are six components of program evaluation. Also, as was
inferred at the beginning of this report, these components should not be thought of as
sequential, but instead that an effective program evaluation will infuse each of the components
at opportune times. Sometimes, these components need to be returned to later on, as well,
such as finding the time, which has prominence at many points in the busy lives of schools.
Overall, these components are depicted here as reflecting benchmarks that an agency
should reach at some point or points during a program evaluation. Like slices of pizza, it is not
important to eat them in a specific order but rather to reflect on the whole pie. With that said,
the work of each of the five fellows will be described in more detail in the following section.
The Six Components of Program Evaluation
Scaling and
Building out
(Michigan Dept. of
Education/Dept. of
Tech., Mgmt. and
Budget)
Literature
Review/
Research
Creating a
Vision
(Fayette County
Public Schools)
Finding
the Time
(Fayette Country
Public Schools)
Completing the
Task / What to
Do Next
(Minneapolis
Public Schools)
Strategizing,
Refining, Etc.
(Knox County
Schools)
1
6 2
5 3
4
SCALING BARRIERS TO ENSURE SUCCESS IN PROGRAM EVALUATION
16
Case Studies by Individual Agencies
Fayette County Public Schools
Fayette County Public Schools (FCPS) is located in central Kentucky and serves more
than 40,000 students from the Lexington metro area. FCPS has 66 schools and programs across
the district that each focus on doing what is best for all students. Our mission is to create a
collaborative community that ensures all students achieve at high levels and graduate prepared
to excel in a global society. We have dedicated employees who share the common goal of
providing a world-class education to each and every student in the district. We also have
amazing support from our families, business community and civic leaders, who are all intent
on creating a positive environment for students to learn and succeed. This support is evidenced
by the state and national accolades that our students and staff members receive in academic,
athletic and professional arenas every year.
FCPS had two fellows participate in the Strategic Data Project with a focus in the area of
Program Evaluation—Robert Sayre and Daphne Jenkins.
Robert Sayre has worked for Fayette County Public Schools for 17 years as a teacher,
coach, Dean of Students, associate principal, and district administrator. Robert was asked to
leave his assignment as an associate principal at one of the district high schools to manage the
districts involvement in the Spending Money Smartly Initiative with the Gates Foundation, and
to become one of the SDP Fellows for the district. During this process, Robert has been named
the Interim Director of Data Management, Planning, and Program Evaluation to begin
developing a department of Data Management, Planning, and Program Evaluation where he
develops systems and structures for evaluating program effectiveness within the district. This
area will be essential to guide the Superintendent and Board of Education with resource
allocation, using data as a common guiding factor.
Due to a district transition, Daphne Jenkins joined SDP during the second year of the
fellowship. Daphne has worked for FCPS for over 16 years, and her background is focused more
towards the technology processes of the district and working with student-level data. Daphne
works on importing, extracting, updating, cleaning, and compiling data. She also works to
create various custom reports which help schools track, monitor, and evaluate student-level
SCALING BARRIERS TO ENSURE SUCCESS IN PROGRAM EVALUATION
17
data. When FCPS began the discussions of a program evaluation department, it was determined
that she should be moved into that department.
When FCPS joined the Strategic Data Project, there was a recognized need to be able to
evaluate programs throughout the district. As such, Robert and Daphne began working with a
capstone group whose focus was program evaluation. During the two-year fellowship, FCPS
experienced many administrative transitions that prevented official development of a program
evaluation department. However, through SDP, Robert and Daphne have been able to narrow
their focus to two areas of program evaluation development that have been critical to their
work at FCPS: creating a vision and finding the time.
Along with identifying two focus areas deemed essential in the process of both
developing a program evaluation department and actually conducting program evaluations,
FCPS modified their research question so that it would be more specific for the agency’s current
needs. Throughout the process of creating a vision, both for the department and for the need
to evaluate programs, it was essential that the time spent doing so would be used in the most
effective manner. Thus the research question of the agency became: what types of programs
will be evaluated and what are the filters that will be applied to future programs for
consideration?
Administration in the agency has still not stabilized, but discussions regarding the need
for program evaluations are ongoing. As the agency continues to create a vision for the
department and stresses the need to find time for evaluations, the specific research question
will help provide a focus as program evaluations get started. Also, a rubric was developed
during the fellowship that centered on the research question and is intended to help the
agency prioritize and focus on programs that will provide the greatest return on investment for
students and the district.
Creating a Vision: In 2013, Fayette County Public Schools became involved in the
Spending Money Smartly Initiative in partnership with the Gates Foundation. This initiative was
sought after to align FCPS’s processes and practices to become more efficient and effective
with the allocation of resources. During this initiative and while working with the District
Management Council from Boston, it became very clear that FCPS did not have any formal way
to manage or evaluate new or current programs. Because of the previous, relative stability of
SCALING BARRIERS TO ENSURE SUCCESS IN PROGRAM EVALUATION
18
funds and student achievement, FCPS had become complacent and continued to layer supports
and programming without any true evaluative process. This all changed when a significant
budget deficit was announced during the 2013–14 budget cycle. Fayette County’s collaboration
with the Strategic Data Project also helped solidify the need for the utilization of data to make
decisions about which programs were/are being effective for the group of students they serve.
This led to the initial development of an FCPS data team. A first iteration of individuals from the
Grants Department and the Assessment Department were placed together to begin developing
systems and structures for aligning data and evaluating programs.
After months of intense meetings and conversations with the interim superintendent,
Board of Education, executive cabinet, and community stakeholders, explaining how program
evaluation and aligning the data systems in FCPS will allow the district to reallocate resources to
support the programs and services that produce the best outcomes for students, the Board
approved the position of Director of Data Management, Planning, and Program Evaluation.
The initial work of the Data Management, Planning, and Program Evaluation
Department (DMPP) will be to align the district data systems and begin engaging our
stakeholders. Engaging key stakeholders when implementing a new strategy is critical to its
success, particularly when it is a strategy to evaluate the effectiveness of initiatives.
Communicating with stakeholders and inviting key constituents to participate in the process,
beginning with selecting which program to analyze, can help ensure buy-in in the later steps.
Starting the program evaluation process by communicating effectively and engaging
stakeholders will allow for a smooth transition to a new approach of evaluating the
effectiveness of programs.
Step 1—Our plan is to begin educating key stakeholders about program evaluation
before taking the first steps towards program analysis. Prior to identifying programs for
analysis, the DMPP will engage in a campaign to introduce key players to the concept of
program evaluation. In FCPS the idea of formalized program evaluation is unfamiliar and may
elicit negative responses. It is critical for key stakeholders to understand how program
evaluation will be used to boost student achievement. All of the key stakeholders who may be
impacted by the outcomes of program evaluation or who will be asked to make decisions based
SCALING BARRIERS TO ENSURE SUCCESS IN PROGRAM EVALUATION
19
on this work will receive an overview or training. The education of these groups early in the
process will make the decision-making later on much easier.
Step 2—Program evaluation in FCPS will be used as a tool to increase the quality and
effectiveness of services to students, and it is important to make this distinction and explain it
in this way. By bringing principals, district leaders, and board members into the conversation
early, it is possible to build understanding for the value of the idea of program evaluation and
data-driven decision making.
Finding the Time: The DMPP will begin its work plan by creating a thorough list of
current and upcoming programs, strategies, or efforts as potential candidates for the evaluative
process. FCPS does not have the resources to analyze multiple programs each year. Trying to
determine the best candidates for a program evaluation analysis can be a resource-intensive
and politically sensitive process if it is not organized in a thoughtful way. The DMPP will work
with various departments, schools, and the new superintendent to create a list of all of the
district’s major initiatives, either current or upcoming. We will encourage the group to think
broadly about what constitutes a program, strategy, or effort. It is also important to include
things that are not typically called programs but are important elements of the district's
strategy to serve students, for example:
• Preschool and kindergarten readiness
• Extended day for struggling students
• Programs funded by Title I
One strategy to ensure buy-in from stakeholders will be to make sure that the DMPP
includes multiple departments and schools in the process of creating the list to ensure
completeness and accuracy. Without this step, it may become difficult to generate a complete
list of programs, strategies, and efforts. The DMPP will guide the process and it may be easier
for principals and department heads to create a complete and accurate list if they approach the
task one category at a time.
• Type of program (e.g., curriculum initiative, instructional strategy, indirect
services, or non-academic programs)
• Level (e.g., elementary, middle, high)

SCALING BARRIERS TO ENSURE SUCCESS IN PROGRAM EVALUATION
20
A Program, Strategy, and Effort Organizer Tool: The tool below was developed
with assistance from the District Management Council, to capture all programs, strategies and
effort within the district:
Instructions—List all major programs currently in use in your school or department as
well as any programs that you plan on launching in the near future. Major programs can
comprise a variety of items, including, but not limited to, programs aligned with district
priorities, programs funded by Title I, programs serving the district’s neediest students,
and programs that require significant investment of staff time or dollars.
Table 2. Program, Strategy, and Effort Organizer Tool
Curriculum
Initiatives
Instructional
Strategies
Support
For Teachers
Non-Academic
Programs
e.g., Read 180;
elementary world
language initiative
e.g., additional
reading block for
struggling readers;
class size reductions;
alternative schools
e.g., Teacher
mentorship program;
focused PD initiative
e.g., Middle school
social worker program;
autism inclusion
program; parent
engagement initiative
The next step is to set minimum threshold criteria for size and scope to focus the list on
high-potential candidate programs. This process will work as a filter, ensuring that there will be
significant value and adequate resources to perform an evaluation analysis on the program. The
threshold criteria should eliminate programs that are not aligned to district strategy, are too
politically sensitive, or are too small in scope.
There are a variety of reasons that a program may not be ready for a program
evaluation analysis, including:
• It is not a key element of district strategy.
• The scope (number of student served) or costs are too small for any changes
resulting from the analysis to be impactful.
SCALING BARRIERS TO ENSURE SUCCESS IN PROGRAM EVALUATION
21
• The program is a political hot topic. Such an effort may not be the best candidate
for a program evaluation analysis if the political situation will prevent any
meaningful changes.
Thoughtful program selection is one of the most important steps in the evaluation process and
can be managed effectively by using a structured program selection rubric.
High-potential candidate programs can be prioritized on a more comprehensive level.
This process seeks to identify which of the programs, strategies, or efforts has the greatest
potential to generate results that can be acted upon and have the most significant impact on
students as a result of an evaluation. The program selection process should consider scope,
investment of dollars and staff time, and the political context surrounding the program.
Selecting a program with a good chance of leading to results that can be acted upon and
tangible change is critical to gain momentum for the concept of program evaluation in the first
few analyses. Ideally, the analysis should focus on a program whose owner wants to use the
report to inform future implementation.
Trying to avoid debate concerning why a specific program is targeted for program
evaluation analysis is key to avoid any distraction from the ultimate goal: to increase the quality
of services to students. Selecting a program that has previously been a contentious topic of
discussion, whether amongst district employees or in the community at large, can create an
opportunity for critics to question the transparency and objectivity of the process.
The second tool, a detailed Program Evaluation Rubric was developed (See Appendix B),
with assistance from the District Management Council, to select high-potential programs,
strategies, or efforts for the evaluation process.
Knox County Schools
Knox County Schools is a district of approximately 56,000 students in eastern Tennessee. Knox
County’s core mission is to ensure excellence for every child by ensuring access to differentiated and
high quality instruction. The Office of Accountability has been tasked with determining how the efforts
of Knox County Schools are impacting key indicators for this goal. Clint Sattler, a data analyst for Knox
County Schools, was enrolled in the Strategic Data Project in the fall of 2013 in an effort to strengthen
the district’s analytic capacity.
SCALING BARRIERS TO ENSURE SUCCESS IN PROGRAM EVALUATION
22
Project History: The Office of Accountability has a long but varied history in Knox
County Schools (TN). The office originally functioned to provide logistical and administrative
support around district, state, and national testing. The scope of the department increased in
the late 1990’s to begin addressing other data needs around the district as well as processing
outside research requests. With the passage of the No Child Left Behind Act (NCLB) in 2001,
demand increased for predictive analytics and retrospective program analysis. The department
has been able to grow its analytic capacity and demand for evaluative services starting with an
influx of grant dollars in the district due to the federal Race to the Top grant. Currently, the
Office of Accountability includes four analysts, a testing coordinator, and administrative staff.
Early in the Office’s history, formal program evaluation was a result of grant compliance
and general curiosity of those who had access to the data. Evaluations were designed long after
the initial kickoff of each initiative and only if some party was interested enough in the outcome
to request it. In 2011, an effort was made to begin systematic program evaluation. Budgetary
concerns became the main driver for determining which projects were slated for evaluation.
Priority went to high dollar programs and mid-range investments where grant funding was
ending. The intention was to inform the district budgeting process as to what investments
should continue with general purpose funds. The resulting report became the first Educational
Return on Investment (eROI) report from the Office of Accountability.
In 2013, the eROI process was adjusted to better align with the district’s five-year
strategic plan, “Excellence for All Children,” and in concert with work done by the Parthenon
group, a consulting firm who partnered with KCS through the Bill and Melinda Gates Smarter
Spending Initiative. The Parthenon Group facilitated in the planning of a large scale district
initiative to provide one-to-one student-to-computer ratios in order to increase personalized
learning (PLE) in KCS classrooms. The Office of Accountability mapped out the initial evaluation
plan of the PLE in a collaborative process with the PLE program managers prior to program
implementation. The first formative evaluation of the PLE initiative was released as part of the
2014 eROI report and is included at the end of this report (See Appendix C).
As our partnership with the Parthenon group closed, the KCS partnership with the
Strategic Data Project began. This continuity has allowed for a natural evaluation of our
SCALING BARRIERS TO ENSURE SUCCESS IN PROGRAM EVALUATION
23
evaluative processes. The lessons learned from our previous work and input from SDP staff,
partners, and alumni are still shaping the face of program evaluation in Knox County.
Project Scope: KCS began the implementation of its new five-year strategic plan,
“Excellence for Every Child”, with an emphasis on creating a culture where very child has the
opportunity to reach his or her potential. The Department of Research Evaluation and
Assessment (REA, a branch of the KCS Office of Accountability) has been tasked with utilizing
quality program evaluation to determine which district initiatives are moving us closer to or
goal of “Excellence for Every Child.”
Reaching this goal will only be possible if the Office of Accountability commits itself to
better align its processes and workflow with the principals of the Program Evaluation
Standards, as previously described in Appendix A, and generally accepted best-practices. Doing
so requires better standardization of our internal processes as well as deeper collaboration with
our stakeholders. Evaluation can no longer be a backward look at superficial data associated
with a program. Key questions and indicators must be identified as program managers build
their initiatives from concept to execution. Knox County’s collaboration with the Strategic Data
Project and its associated network has played a role in facilitating our evolution towards best
practices. The Office of Accountability is pushing partnering stakeholders to consider the
ultimate evaluation of their program concurrent with the design of the initiatives themselves,
while also standardizing our processes to ensure we are producing high-quality work.
The initial work to standardize the KCS evaluation workflow began in the fall of 2014.
KCS determined the first step in adjusting our process related to defining the scope of any
program evaluation through a planning form. The intention was that the evaluation planning
form (See Appendix D) would serve as a collaborative tool to map out the program evaluation
with the architects of the initiatives and explicitly tie the program’s theory of action to
measurable outcomes. Completing the form would help the evaluator understand the explicit
needs of the program manager, while also helping the evaluator gain insight into the
expectations of the program manager and the goals and culture of the program to be studied.
The information collected in the form defines the scope of the program evaluation, applicable
timelines, and the level of detail required in subsequent reporting. In addition, the key
stakeholders of the program to be evaluated are identified on the planning form. Identifying

SCALING BARRIERS TO ENSURE SUCCESS IN PROGRAM EVALUATION
24
the key stakeholders from the outset allows the ultimate findings to be presented in a context
that is valid and valuable to those involved.
The key information collected on the planning form helps to define the logic model of
the program to be evaluated in very non-technical language. This process is important in
creating explicit links between outcomes and the issues we are trying to solve. In essence, the
five questions we ask, as depicted in Table 3, can help to define the reasoning behind the entire
evaluative effort.
Table 3. Key Planning Questions for a Program Evaluation
What is the
problem?
How do I know this
is a problem?
How am I
addressing the
problem?
What will
happen if I
solve the
problem?
How will I know?
What problem or
issue are we
attempting to
address?
What indicators
illustrate that this
is a problem?
What are the
steps being
implemented in
this program to
address this
problem?
What are the
intended effects
of the program
on this
problem?
What data are
requested to
measure
progress?
It is important to note that the evaluation planning form does not create a binding
contract between the program manager and the program evaluator. It is implicitly understood
that program evaluation is fluid. However, the key information on the evaluation form must be
collected again if the program goals or scope change due to stakeholder perceptions, wants or
needs. This helps to ensure that the evaluator and program manager agree on the redefined
scope of the project.
We are also taking steps internally to ensure that we are adhering to defendable
evaluative processes. The first step in this process is determining if a program should be
evaluated. This helps to ensure that departmental resources are being responsibly, effectively,
and efficiently deployed. Figure 3 depicts an important first step in determining the merits of a
program for future evaluation.

SCALING BARRIERS TO ENSURE SUCCESS IN PROGRAM EVALUATION
25
Figure 3. Deciding Whether or Not the Program Should be Evaluated
The final piece of information collected on the internal planning form is in regards to the
quality of the data and information that is being used to judge the merit of a program. In the
YES
YES
NO
NO
NO
YES
NO
YES
YES
NO
Evaluate the program
Is an evaluation
required for grant or
federal/state/district
compliance?
Do NOT evaluate
the program
Are the intended
outcomes tied to
activities through the
theory of action?
Redesign evaluation
with stakeholders
YES
Redesign evaluation
with stakeholders
Can outcomes be
measured using
attainable and
dependable data?
Evaluate the program
Will evaluation
play a role in the
decision making
process
Do the Intended users
agree as to how the
evaluation outcome
will be used?
NO
Do concerns exist
regarding the ethics
of evaluating the
program?

SCALING BARRIERS TO ENSURE SUCCESS IN PROGRAM EVALUATION
26
past, our evaluations relied on whatever data was available, regardless of the data’s reliability.
Examples of low-quality data would include attendance reports using hand written names (and
sometimes nicknames) to determine intervention attendance. We are now moving to a system
of grading data sources. Data sources that grade out as an F will not be allowed to be used in
data analysis for program evaluation, nor can the majority of data sources score below a C.
Most important, we are willing to work with stakeholders to create new data sources where
high quality data sources are currently lacking or nonexistent. An example of classification
criteria is contained in Table 4.
Table 4. Example Data Grading Rubric
Grade
Identifier-based example
A
Data contains a single unique identifier (student local IDs, teacher license
numbers, Active Directory IDs, etc.) and ≥ 95% of data matches attained with no
manual intervention.
B
Data contains a single unique identifier (student local IDs, teacher license
numbers, Active Directory IDs, etc.) and ≥ 75% of data matches attained with no
manual intervention.
C
Data contains no single unique identifier. Unique identifiers are created through
the combination of non-unique information and provide matches to more than
95% of the data source with no further manual intervention.
D
Data contains no single unique identifier. Unique identifiers are created through
the combination of non-unique information and provide matches to more than
75% of the data source with no further manual intervention.
F
Data contains no single unique identifier. Unique identifiers are created through
the combination of non-unique information and provide matches to fewer than
75% of the data source with no further manual intervention.
N/A Data source does not exist yet.
Results, Impact, and Moving Forward: Despite the progress the Office of
Accountability has made, obstacles to high quality program evaluation still exist. As a result,
there are continuing struggles to effectively leverage REA resources despite the growth of the
department. The REA department is sometimes tasked with evaluating low-dollar, low-impact
pet projects which redirect resources away from the evaluation of higher impact and higher
dollar investments. The department must be more strategic about which programs are
SCALING BARRIERS TO ENSURE SUCCESS IN PROGRAM EVALUATION
27
evaluated with the understanding that the resource commitment that is required for a deep,
mixed methods analysis is considerable.
Although improvements have been made in designing program evaluation prior to
program kickoff, there are still instances where REA staff is not included in the original project
planning. This leads to continuing issues around low quality data, low stakeholder engagement,
and generally decreases the depth of the subsequent evaluation.
Program managers sometimes want to take a kitchen-sink approach to measuring the
impact of a program by including data points that are only peripherally associated with that
program. This approach can weaken the program evaluation because it deemphasizes key
indicators in the analysis.
Thus, recommendations that are made to strengthen the outcomes of a program, even
when made in direct collaboration with the associated program manager are often not put into
practice in the field. The current timeframe for completing program evaluations is incongruent
with the district’s strategic goals. The final drafts of the program evaluations are released
concurrently with the initial drafting of the district’s budget. This provides little time to fiscally
react to the findings of the evaluations.
As a result of the KCS program evaluation, a number of necessary improvements have
been recognized. These are situated as follows in terms of next steps for our district.
• REA is committed to creating deeper partnerships with program stakeholders. Strong
and functional relationships with our stakeholders will shift the focus of our evaluative
work from a backwards look at how the program impacted the district to a proactive
focus on actionable recommendation to strengthen the program. We need to embrace
a culture that seeks active stakeholder participation in the evaluation rather than having
the whole process be controlled by the evaluator.
• REA hopes to increase its flexibility in evaluative practices. We will need to build our
skills and knowledge to have the ability to move to participatory and decision oriented
practices. This will allow for deeper stakeholder involvement in defining the agenda and
boundaries of a program evaluation and hopefully lead to clearer links between project
goals and key indicators.
SCALING BARRIERS TO ENSURE SUCCESS IN PROGRAM EVALUATION
28
• REA must increase the accessibility of our work by differentiating how our findings are
conveyed. Where our department has previously only provided in-depth technical
reports around program impact, we are now moving to providing easy-to-grasp
reporting and graphics around key findings.
• REA is focusing on long term scheduling regarding program evaluation with the ultimate
goal of planning eROI topics at least a year in advance. Our goal is to schedule in-depth
program evaluation only during critical decision points in the project timeline and
provide more superficial formative evaluations in the interim. This will allow us to
allocate our resources in a much more efficient manner and decrease the lag between
evaluation and budgeting activities.
All of the aforementioned changes will take time before they take root as the
operational norms within the district. Participation in the Strategic Data Project, research of
best practices, and collaboration between mentors and SDP Fellows has been instrumental in
providing Knox County with a path forward to strengthen and codify the work that we continue
to make a priority.
Overall, we are confident that the first steps we have taken in this process will provide a
vehicle to help the district meet its larger strategic goals. Through these changes, our core
mission remains the same. We hope to provide decision makers, at all levels of our district, with
information to help them meet their strategic goals.
Michigan Dept. of Education/Dept. of Technology, Management and Budget
Jonathan J. Doll Ph.D., is an SDP Fellow with two Michigan Departments: the
Department of Education through the Office of Education Improvement and Innovation, and
the Department of Technology, Management, and Budget through the State School Reform
Office. His work duties include early warning signs detection, supports for schools to help
disengaged students, and an understanding of the reform process for School Improvement
Grant (SIG) schools. During Dr. Doll’s SDP Fellowship, he transferred to the State School Reform
Office to work more closely with low-performing schools, which is a descriptor of all SIG
schools. This was done to provide more supports to schools in strategic areas using data.
SCALING BARRIERS TO ENSURE SUCCESS IN PROGRAM EVALUATION
29
Agency Profile: Michigan Department of Education has about 400 employees at the
state level. Also, the State School Reform Office, which is under the Michigan Department of
Technology, Management, and Budget, has about nine employees.
The priorities of the Michigan Department of Education are broad involving school
success across the state, but one priority was of crucial importance—close achievement gaps in
the state. That priority became a charge for the direction of Dr. Doll’s fellowship. Also, the main
priority of the State School Reform Office is to help schools move from being in the state’s
lowest 5%to being among the state’s top 25% of schools.
Research Question and Discussion: A single question resonated as Dr. Doll began his
fellowship. It involved a Program Evaluation of the 22 SIG schools under research and was as
follows: If schools could deeply understand the performance of students on state tests according
to gender and ethnicity, could they impact professional practice so that they work towards
closing achievement gaps? At the state level, one of the primary components of school reform
is the concept of change. Also, for schools to be effective, they have to be able to manage
change. In this way, with adequate guidance, reforms can be made and sustained.
Dr. Doll studied the improvements in 22 schools that received multi-million dollar grants
for school improvement, as depicted in Figure 4. Overall, these schools changed in student
proficiency levels by +2.9% over four years. At the same time, their end-of-grant student
proficiency level was 21.0%, which was 11% above the schools that failed in their school reform
efforts during the same time period.

SCALING BARRIERS TO ENSURE SUCCESS IN PROGRAM EVALUATION
30
Figure 4. Map of SIG Schools in Michigan
These SIG schools indeed made changes that could only be appreciated by interacting
with them, as a group and individually. Table 5 provides a snapshot of school-level
characteristics. As such, the research design used for my program evaluation included a pre-
visit survey, a site visit, and then a collective analysis of all information including needs brought
up by each school. In this way, the overall data gained through qualitative and quantitative
means might best reflect the reforms underway.
Table 5. A Snapshot of the Twenty-Two SIG Schools
Community Type
Community Size
Urban 59%
Urban Average Pop. 276,045
Suburban 18%
Suburban Average Pop. 18,402
Rural 23%
Rural Average Pop. 5,451
Average Income/SES $40,842
School Type
Elementary 23%
School/Class Size
Middle School 18%
Small 0–400 27%
High School 59%
Medium 400–900 55%
Large 900–2500 18%
School Demographics
Class Size 1:18
Black 47%
White 32%
School
Hispanic 15%
Grad Rate Before: 87%, After: 77%
Multiracial 3%
Dropout Rate Before: 12%, After: 10%
Asian 2%
Proficiency Rate Before: 18%, After: 21%
American Indian 0%
Native Hawaiian 0%

SCALING BARRIERS TO ENSURE SUCCESS IN PROGRAM EVALUATION
31
At the beginning of Dr. Doll’s fellowship, the state placed a heavy emphasis on the Top-
to-Bottom (TTB) ranking system, which was initially used to identify schools as being low
performing. As such, the program evaluation of the SIG schools was conducted so that schools
were place in quartiles according to their 2013 TTB ranking. This was incredibly beneficial
during the site visits phase so that the insights learned at each of the schools could be collected
and compared to potentially similar findings at school that were close in TTB rank.
A summary of the SIG schools, separated into quartiles by the 2013 Top-to-Bottom
ranking is depicted in Figure 5.
Figure 5. Quartile Summary of SIG Schools
Project Scope and Timeline:
Sustainability Survey: As a group, all were given a Sustainability Survey. This survey was
meant as a preliminary guide for schools in what the Department of Education expected them
to do in terms of sustaining their SIG grant after the funds ran out. It was hoped that each
school would find ways to sustain the work that they had started, and only time would tell.

SCALING BARRIERS TO ENSURE SUCCESS IN PROGRAM EVALUATION
32
Overall, each school had a chance to report on their sustainability efforts during a site visit,
which occurred in the spring of 2014, with analysis occurring after that in the summer of 2014.
Site Visits after Survey: One of the primary ways that change management occurs in
relationships is through listening. Alson and Burnett (2003) provide a list of essential keys for
active listening; each of which were used in site visits:
• Give the speaker your full attention
• Remain centered and calm
• Try to understand the speaker
• Resist mentally digressing to your own agenda
• Show concern through body language, tone of voice, facial expression
• Paraphrase the essence of what is said
• Name or identify speaker’s needs and feelings as you see them
• Use questions or probes to bring out speakers views, needs, and feelings
• Listen with an open heart.
The site visits ranged in time anywhere from one to three hours. Also, two schools were
observed to have achieved strong gains in climate and culture, which impacted teacher practice
and trust among students and faculty, and ultimately created pride in the school buildings.
These schools that improved in culture and climate were visited a second time and videotaped,
as shown in Figure 6. This included interviewing each school’s leadership team as well as the
student leaders in each building.
Figure 6. Photo of Two Site Visits at Schools Making Highest Gains
Weston Preparatory Academy Interview Lincoln Senior High School Interview
Detroit, MI Warren, MI
SCALING BARRIERS TO ENSURE SUCCESS IN PROGRAM EVALUATION
33
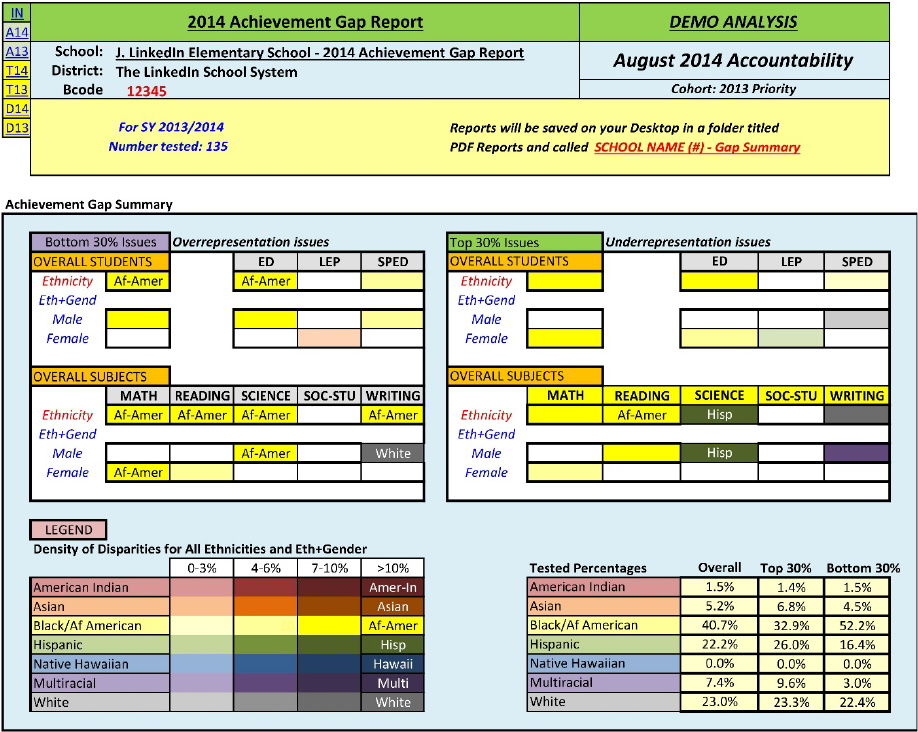
The Achievement Gap Tool: As a result of visiting schools and seeing their
transformations firsthand, an achievement gap tool was built that could better assist medium
and larger sized schools to understand, according to gender and ethnicity differences, which
students were performing better than others of the annual state assessment. This knowledge in
turn could help schools to identify supports that they needed to build in the staff and
pedagogy.
An excellent example of this tool in action occurred in a district where the
superintendent observed that female students were not performing as well as males in that
district’s high school in the area of social studies. The superintendent was able to take this
knowledge and investigate causes, and on that journey learned that all of the social studies
teachers in the high school were male coaches. As a result, the superintendent was able to
support professional development for these teachers so that they could be more successful in
reaching female students.
This is a single example of how the tool, as depicted in Figure 7, can bring change to
schools without using any heavy-handed accountability measures or punishments. There are
many other examples of this type of supportive role with schools; building such a tool has been
very helpful to schools.
SCALING BARRIERS TO ENSURE SUCCESS IN PROGRAM EVALUATION
34
Figure 7. Example of Achievement Gap Tool Dashboard
The hope for the achievement gap tool going forward in 2015–16 is to scale it to be
available to more schools besides the initial 22 SIG Schools. Alternatively, the new use of online
assessments in the state of Michigan may allow this type of tool to be retrofitted onto the
current testing software.
With that in mind, thoughts on policy for the Achievement Gap tool are that it can be an
excellent part of a toolkit for all schools that struggle with large achievement gaps. In Michigan,
these schools are primarily the ones designated Focus Schools.
Discussion of Stakeholder Engagement: Engagement of stakeholders varied during
the site visits to each of the SIG schools. Some visits were only with a principal. Others were
with a principal and superintendent. Still others included all of the school stakeholders, the

SCALING BARRIERS TO ENSURE SUCCESS IN PROGRAM EVALUATION
35
district team, and even the local county education improvement team. Ultimately, the real test
for schools in making significant turnarounds is that of sustainability. Will the said reforms be
measurable years down the road or will they have only been short-term/temporary in nature?
In order to help schools with making sustainable reforms, the State of Michigan reorganized its
state-level reform work so that only one office under the governor will have direct authority
over these schools. As state-level processes also involve many stakeholders, this transition
process will take some time in order to work seamlessly and bring organized reforms to schools.
Results/Impact: Lowest performing schools (quartile 1) had more basic benefits and
insights realized through SIG, as shown below in Table 6. The emphasis of these schools was on
developing new skills.
Table 6. Powerful Practices—Quartile 1 Schools (TTB 1-8, 4 of 6 schools were decreasing in TTB)
Large-sized
urban district
Moderate-sized
urban district
Large-sized
urban district
Large-sized
urban district
Large-sized
urban district
Large-sized
urban district
Academic responses
to behavior
problems
Regular sustained
silent reading
Having forgiveness
as practice, policy
Growth mindset, like
Baruti Kafele teaches
Respect, trust, two-
way communication
Clear expectations,
active participation
Having a student
voice academy
Applying for other
grants; 21
st
century
Some kids lack roots;
we are their anchor
Topical PD for new
teachers including
cultural sensitivity
Increasing parental
engagement, pride
Binders of students,
connect w 4–5 / day
Lots of connection
and community
Interventions vs.
suspensions: PBIS
Develop students to
seek to leave legacy
A behavior cohort:
making a bad class
into a best class
Critical usage of
targeted teacher PD
Boot Camp for
teachers: 185 shared
prep times yearly,
once daily, every day
& 45 min. w/ admin
No silos, but instead
widely successful,
highly acclaimed
teacher education /
student connection
programming
District: Weekly PD
with all teachers in 2
schools
District: 4 academic
coaches: all schools
Improving school
assessments
Improving day-to-
day curriculum
Build capacity of
leadership team
Putting $ in people;
creating processes
Regular sustainable
PD for all staff
Class sizes small for
coaches’ classes
Lots of tech, almost
1–1
Students get daily
homework
Daily reading;
students proud
Creating parent
action leaders,
parents sign contract
Secondly, there were insights from highest performing schools (quartile 4), which were
more highly developed insights, as shown in Table 7. As such, the emphasis of higher
performing schools was on mastery of established skills and extension into new domains.

SCALING BARRIERS TO ENSURE SUCCESS IN PROGRAM EVALUATION
36
Table 7. Powerful Practices—Quartile 4 Schools (TTB 37-92, 2 of 6 were increasing in TTB)
Small-sized
rural district
Small-sized
rural district
Small-sized
rural district
Small-sized
suburban district
Moderate-sized
suburban district
Moderate-sized
suburban district
Community Orgs. /
Parent connections
Awesome monitors
covering all gaps
Read 180 was highly
successful, loved
Deeply helping
homeless kids
Deep listening
model for students,
teachers, and even
the district
Credit recovery and
dual credit courses
District watches in,
coaches not directs
Citizenship –
student own where
they are going in life
Effective RTI system
to redirect to
plusses
Data culture leads
to high std
expectation
Giving kids multiple
oppts for success
Success breeds
success, feeling safe
Improving and
extending AP
classes
Adding Character Ed
(through S
3
grant)
Think outside the
box
Be resourceful
No silos, but instead
a joined commerce
No blame disease,
so listening for all is
big
Great leadership
styles & facilitators
Great monitor leads
to ‘nothing to hide’
Reform is organic
growing up not
down
District embraced
team-culture
Developing a good
sustainability plan
Mentoring for staff
and students
Summary of Key Successes and Challenges: The main challenge in this project was
keeping a continual impact on future cohorts of SIG schools. While the work on the SIG Cohort I
schools was underway, SIG Cohort II schools also entered their sustainability year. This requires
continual state-level collaboration with many stakeholders, along with requisite training, in
order to further sustainability aims.
Next Steps: At the current time, the Achievement Gap Tool is being prepared for use in
2015–16, although it is possible that the project will be discontinued. Agency priorities have
thus far supported this project. However, as the state has migrated to an online student testing
platform, it is hoped that some of the benefits of the SAS Enterprise Guide, Excel-driven
Achievement Gap Tool can realized using online diagnostics.
Lessons Learned
Now that the program evaluation work of each agency has been discussed, and the
insights from their respective research underscored, it is important to ask what benefits came
to the group as a whole. First and foremost, the biweekly connection of the fellows through
regular phone conferences enabled each fellow to clarify their research. Second, there was an
added benefit that the group of fellows traced the overall scope of what effective program
evaluation should look like when it is done with efficacy. In addition to those two overarching
benefits, there were additional highlights that came from our two-year collaboration.
SCALING BARRIERS TO ENSURE SUCCESS IN PROGRAM EVALUATION
37
Creating a Vision
The main lessons learned were that without a vision, no successes can be expected. It
took a great deal of time at the beginning of each program evaluation to plot a way forward
that would be most feasible and beneficial to the agency. Then, and with that vision, it was
possible to deal with the road blocks, speed bumps, and other challenges that occurred along
the way.
Finding the Time
Like with the process of creating a vision, ample time must be allotted with an agency
not only to scope a program evaluation, but also to conduct it and later to evaluate the results.
In far too many agencies, a program evaluation is undertaken with the right steps and rigor, but
afterwards no one in the agency is concerned about the results. Thus, it is incumbent on the
program evaluator to maintain agency involvement at each step in the process.
Strategizing, Refining a Plan and Pushing Forward
Creating buy-in and prioritizing projects for program evaluation can seem like a daunting
task, but even after these goals have been accomplished, obstacles to successful program
evaluation still exist. The most vital element to the long-term success of program evaluation
lies with stakeholder engagement. As you refine your evaluation processes and plans, ensure
that you are building continued support for program evaluation from those that implement the
programs themselves. The ultimate success of a program evaluation will be stronger when built
from the ground up, rather than from a top-down mandate.
Completing the Task, What to Do Next
Developing stamina within an agency can be very difficult, especially with continually
changing requirements imposed from outside agencies and fluctuating budgets available to
districts and schools. As such, it might be in a context of waning interest that a program
evaluation is conducted. However, this is where the program evaluation, if complete correctly,
can have the most benefit for the agency.
Scaling and Building Out
SCALING BARRIERS TO ENSURE SUCCESS IN PROGRAM EVALUATION
38
Finally, after a program evaluation is successfully completed and the results are shared
within the agency, there may be the possibility that future evaluations, instruments, or insights
can be created and disseminated for the general good for the schools involved. This is not
always the case in every program evaluation, but when these goals are able to be reached, the
benefits can be quite impressive, especially within a broader context than that of the original
program evaluation.

SCALING BARRIERS TO ENSURE SUCCESS IN PROGRAM EVALUATION
39
References
Allen, T., Ammon, S., Breshears, A., Drace, B., Husemen, J., Jensen, D., & Orcutt, V. (2014).
Common Core State Standards (CCSS) – Higher education’s role in developing education
professionals: An evaluation of the network for instructional support and enhancement
(NISE) program at the University of Central Missouri. Retrieved from:
http://educationalrenaissance.org/index.php/edren/article/download/70/pdf
Bernhardt, V. (2004). Data analysis for continuous school improvement. NY: Routledge.
Caracelli, V., Greene, J. (1993), Data Analysis Strategies for Mixed Method Evaluation Designs.
Educational Evaluation and Policy Analysis 15 (2).
Caracelli V., Greene, J. (1997). Crafting Mixed-Methods Evaluation Designs, New Directions for
Evaluation.
Churchill, W. (1925, June 23). House of Commons. Retrieved from:
https://www.winstonchurchill.org.
Degracie, J. & Merrill, B. (1994). Implications of using the revised program evaluation standards
in local education agencies. Journal of Experimental Education 63(1).
Fitzpatrick, J., Sanders, J. Worthen, B. (2011), Program Evaluation: Alternative Approaches and
Practical Guidelines, 4th Ed, Pearson.
Joint Committee on Standards for Educational Evaluation. (2014). Program evaluation standards
statements. Retrieved from: http://www.jcsee.org/program-evaluation-standards-
statements.
Murnane, R. & Willett, J. (2010). Methods Matter: Improving causal inference in educational
and social science research. London: Oxford University Press.
Ross, M. (2010). Designing and using program evaluation as a tool for reform. Journal of
Research on Leadership Education 5(12.7).

SCALING BARRIERS TO ENSURE SUCCESS IN PROGRAM EVALUATION
40
Appendix A: Program Evaluation Standards Statements
from the Joint Committee on Standards for Educational Evaluation
10
Excerpted from:
Yarbrough, D. B., Shulha, L. M., Hopson, R. K., & Caruthers, F. A. (2011). The program evaluation
standards: A guide for evaluators and evaluation users (3rd Ed.). Thousand Oaks, CA: Sage.
The standard names and statements, as reproduced below, are under copyright to the JCSEE and are
approved as an American National Standard. Permission is freely given for stakeholders to use them for
educational and scholarly purposes with attribution to the JCSEE. Authors wishing to reproduce the
standard names and standard statements with attribution to the JCSEE may do so after notifying the
JCSEE of the specific publication or reproduction.
Utility Standards
The utility standards are intended to increase the extent to which program stakeholders find evaluation
processes and products valuable in meeting their needs.
• U1 Evaluator Credibility Evaluations should be conducted by qualified people who establish and
maintain credibility in the evaluation context.
• U2 Attention to Stakeholders Evaluations should devote attention to the full range of
individuals and groups invested in the program and affected by its evaluation.
• U3 Negotiated Purposes Evaluation purposes should be identified and continually negotiated
based on the needs of stakeholders.
• U4 Explicit Values Evaluations should clarify and specify the individual and cultural values
underpinning purposes, processes, and judgments.
• U5 Relevant Information Evaluation information should serve the identified and emergent
needs of stakeholders.
• U6 Meaningful Processes and Products Evaluations should construct activities, descriptions, and
judgments in ways that encourage participants to rediscover, reinterpret, or revise their
understandings and behaviors.
• U7 Timely and Appropriate Communicating and Reporting Evaluations should attend to the
continuing information needs of their multiple audiences.
• U8 Concern for Consequences and Influence Evaluations should promote responsible and
adaptive use while guarding against unintended negative consequences and misuse.
Feasibility Standards
The feasibility standards are intended to increase evaluation effectiveness and efficiency.
• F1 Project Management Evaluations should use effective project management strategies.
• F2 Practical Procedures Evaluation procedures should be practical and responsive to the way
the program operates.
10
Joint Committee on Standards for Educational Evaluation. (2014). Program evaluation standards statements.
Retrieved from: http://www.jcsee.org/program-evaluation-standards-statements
.

SCALING BARRIERS TO ENSURE SUCCESS IN PROGRAM EVALUATION
41
• F3 Contextual Viability Evaluations should recognize, monitor, and balance the cultural and
political interests and needs of individuals and groups.
• F4 Resource Use Evaluations should use resources effectively and efficiently.
Propriety Standards
The propriety standards support what is proper, fair, legal, right and just in evaluations.
• P1 Responsive and Inclusive Orientation Evaluations should be responsive to stakeholders and
their communities.
• P2 Formal Agreements Evaluation agreements should be negotiated to make obligations explicit
and take into account the needs, expectations, and cultural contexts of clients and other
stakeholders.
• P3 Human Rights and Respect Evaluations should be designed and conducted to protect human
and legal rights and maintain the dignity of participants and other stakeholders.
• P4 Clarity and Fairness Evaluations should be understandable and fair in addressing stakeholder
needs and purposes.
• P5 Transparency and Disclosure Evaluations should provide complete descriptions of findings,
limitations, and conclusions to all stakeholders, unless doing so would violate legal and propriety
obligations.
• P6 Conflicts of Interests Evaluations should openly and honestly identify and address real or
perceived conflicts of interests that may compromise the evaluation.
• P7 Fiscal Responsibility Evaluations should account for all expended resources and comply with
sound fiscal procedures and processes.
Accuracy Standards
The accuracy standards are intended to increase the dependability and truthfulness of evaluation
representations, propositions, and findings, especially those that support interpretations and judgments
about quality.
• A1 Justified Conclusions and Decisions Evaluation conclusions and decisions should be explicitly
justified in the cultures and contexts where they have consequences.
• A2 Valid Information Evaluation information should serve the intended purposes and support
valid interpretations.
• A3 Reliable Information Evaluation procedures should yield sufficiently dependable and
consistent information for the intended uses.
• A4 Explicit Program and Context Descriptions Evaluations should document programs and their
contexts with appropriate detail and scope for the evaluation purposes.
• A5 Information Management Evaluations should employ systematic information collection,
review, verification, and storage methods.
• A6 Sound Designs and Analyses Evaluations should employ technically adequate designs and
analyses that are appropriate for the evaluation purposes.
• A7 Explicit Evaluation Reasoning Evaluation reasoning leading from information and analyses to
findings, interpretations, conclusions, and judgments should be clearly and completely
documented.
• A8 Communication and Reporting Evaluation communications should have adequate scope and
guard against misconceptions, biases, distortions, and errors.

SCALING BARRIERS TO ENSURE SUCCESS IN PROGRAM EVALUATION
42
Evaluation Accountability Standards
The evaluation accountability standards encourage adequate documentation of evaluations and a
metaevaluative perspective focused on improvement and accountability for evaluation processes and
products.
• E1 Evaluation Documentation Evaluations should fully document their negotiated purposes and
implemented designs, procedures, data, and outcomes.
• E2 Internal Metaevaluation Evaluators should use these and other applicable standards to
examine the accountability of the evaluation design, procedures employed, information
collected, and outcomes.
• E3 External Metaevaluation Program evaluation sponsors, clients, evaluators, and other
stakeholders should encourage the conduct of external metaevaluations using these and other
applicable standards.

SCALING BARRIERS TO ENSURE SUCCESS IN PROGRAM EVALUATION
43
Appendix B: A Program Selection Rubric
Directions: List the high-potential programs, strategies or efforts, then score each of them.
Key: 0=Not at all; 5=Definitely
Primary
Considerations
(1–5 scale)
Secondary
Considerations
(1–3 scale)
Other
Considerations
(0–1 scale)
Program or
Strategy
Aligned
to
strategy
Large reach
or plans for
expansion
Significant
investment
of staff time
Significant
investment
of funds
Direct
impact on
learning
Politically
feasible
to change
Data
available
Uncertain
effectiveness
Total
Ranking
Ex. Read 180
4
2
4
4
3
1
1
1
20

SCALING BARRIERS TO ENSURE SUCCESS IN PROGRAM EVALUATION
44
Appendix C: Evaluation of Personalized Learning Initiative, Knox County Schools
Overview – In SY1314, Knox County Schools made a significant investment in computing devices
and associated professional development to fully integrate technology within a subset of 11 KCS schools.
The resulting School Technology Challenge (STC) created a 1:1 student to device ratio with the main
objective of increasing teacher effectiveness to drive increases in student outcome data. The STC theory of
action highlights three areas of focus for meeting this main objective. The foci are listed below.
1) Increase the individualization and differentiation of student-centered instruction.
2) Increase student affinity, motivation and engagement in the classroom.
3) Increase the effectiveness of teaching through both 1) and 2) while integrating technology-
based education aids.
Investment Analysis and Findings – The SY1314 formative analysis indicates that the STC is very
clearly a work in progress. Data collected through focus groups, survey, and classroom observations
indicate that the depth technology integration is likely not yet deep enough to move the needle on many
key student outcome indicators. Results relating the STC theory of action are highlighted below.
• Increasing Student Engagement, Motivation, and Affinity: Common themes from teacher focus
groups indicated that students were more engaged in classwork when the technology was used in
the classroom. Student responses to pre and post deployment surveys corroborate this perception.
TRIPOD data provides further evidence of student engagement as the Captivates domain was
directional higher for STC schools (compared to control schools).
• Attendance: There was no statistical difference in the change in attendance rates between STC and
control schools. There is little evidence to indicate that the STC had any impact on student
attendance rates.
Intial Training:
June 2013
Device
Deployment:
Oct 2013
1st Formative
Evaluation:
Dec 2014
Interim
Evaluation:
Spring 2015
2nd Formative
Evaluation:
Dec 2015
Summative
Evalaution:
Dec 2016
Our Strategic Goal is a
focus on the student
By increasing student
engagement,
motivation and affinity
As measured by
•Student Surveys
•Attendance
Our Strategic Goal is
providing effective
instruction
By increasing the
individualization and
differentiation of student-
centered instruction
As measured by
•Observation Scores
•PLE rubrics
•Student Outcome Data

SCALING BARRIERS TO ENSURE SUCCESS IN PROGRAM EVALUATION
45
• Increase the individualization and differentiation of student-centered instruction: Rubrics
regarding Technology Integration (TIM) and Personalized Learning (PLE) were scored from a pool of
112 randomly selected teachers. The majority of teachers scored in the earliest stage of technology
integration. Teachers scored better on the PLE matrix, but almost all data indicated that teachers
were operating in an “Emerging” state of personalizing the learning environment. The results echo
common themes from the teacher focus groups. Respondents felt that this year was more of an
experimental year to determine what processes worked in the classroom and what processes did
not.
• Increase the effectiveness of teaching through technology integration: Since the depth of
technology integration and personalization does not appear to be sufficient to fundamentally
change the classroom experience, it is probably too early in the process to expect large changes in
student outcome data. TVAAS data provides some directional evidence of school-wide increases,
but the effects are not statistically different than the control group. There is no evidence yet of any
systematic closure of performance gaps, and results regarding achievement data are similarly
mixed. Focus group respondents felt they were better prepared to enter year two of the STC with
strategies to deepen personalization and help significantly impact student outcomes.
Final Recommendations – It is important to note that the school technology challenge has always
been viewed as a multi-year project. This analysis can serve as a formative signpost for the initiative, but it
is too early in the life cycle for the project to determine its true worth to the KCS.
Based on the timeline for program implementation and review, the REA team makes the following
recommendations in regard to the school technology challenge.
• KCS should continue to focus on continuing professional development, training, and promoting
teacher-to-teacher collaboration to maximize the benefits of the STC.
• Available formative data and mid-year rubric scores should form the backbone of an interim
formative analysis on STC implementation. Note, however, that formative data will be universally
available only for elementary schools.
• Present the findings of the SY1314 formative program evaluation to the teachers at participating
STC schools and begin the SY1415 cycle of data collection through teacher focus groups in the
Spring of 2015.
Our Strategic Goal is to
enable student learning
through infrastructure
By increasing the
effectiveness of teaching
through technology
integration
As measured by
•Student Surveys
•TIM rubric

SCALING BARRIERS TO ENSURE SUCCESS IN PROGRAM EVALUATION
46
Appendix D: Evaluation Planning Template (Page 1)
Program Parameters
Project Name:
Brief Description of Program w/ major goal:
Reason for Evaluation (Check One)
Compliance ☐ Pilot/New Program ☐ Potential Expansion ☐ Potential Cessation ☐ Other (Specify) ☐
Description for “Other” :
Frequency of Evaluation
How often is a formal evaluation desired?
Is an interim evaluation desired?
How often is interim eval. desired?
When will the final decision to continue or end the program occur?
Requested Detail for Level of Evaluation and Reporting
Memo ☐ Full Technical Report ☐
(1–2 pages outlining results of high level analysis) (Outlining of methodology and technical details of analysis)
What are the projected funding sources for this project?
Program Personnel
Project Manager (Prime point of contact):
Key Leadership and Practitioners (Name and Role) Provide
more on attachment
Participants (Schools, Subset of Students, etc.)
Provide more on attachment

SCALING BARRIERS TO ENSURE SUCCESS IN PROGRAM EVALUATION
47
Evaluation Planning Template (Page 2)
What is the
problem?
How do I know
this is a
problem?
How am I
addressing the
problem?
What will
happen if I
solve the
problem?
How will I
know?
What problem
or issue are we
attempting to
address?
What
indicators
illustrate that
this is a
problem?
What are the
steps to being
implemented in
this program to
address this
problem?
What are the
intended
effects of the
program on
this problem?
What data are
requested to
measure
progress?
Primary Goal
Secondary
Goal
Tertiary Goal
Attach additional sheets if more than three goals are targeted by the program.
