
Bill de Blasio, Mayor
Vincent Sapienza, Commissioner
2017
New York Harbor
Water Quality Report

Dear Friends,
With 522 miles of shoreline, New York City’s waterways are one of our greatest
assets. Over the past decade, the City has invested more than $12 billion to up-
grade the sewer system and wastewater treatment plants to improve the health of
these critical ecosystems. This investment, over time, has produced many ecolog-
ical successes, ushering in the return of a variety of plant and animal species to
our waters – including whales! It has also allowed for the redevelopment of vast
swaths of our waterfront and numerous recreational opportunities for residents
and visitors.
These encouraging signs further illustrate that New York Harbor is healthier than it
has been in more than a century. This historic achievement is a direct result of sub-
stantial investment in our infrastructure, utilization of innovative new technologies,
and partnerships with elected officials, environmental advocates, and New Yorkers
who share our commitment to the natural world. As a protector of public health
and the environment, the New York City Department of Environmental Protection
(DEP) is leading efforts to restore the Harbor’s natural ecology, from building Green
Infrastructure and separating sewers, to significantly reducing nitrogen discharges
and reconstructing acres of natural wetlands.
I am pleased to share the 2017 Harbor Water Quality Report and I encourage you
to read this in conjunction with the NYC Stormwater Management Plan, the NYC
Green Infrastructure Annual Report and the State of the Sewers Annual Report
to gain a more complete view of the City’s coordinated efforts to restore our vital
waterways.
Vincent Sapienza, P.E.
Commissioner
Sincerely,
Vincent Sapienza, P.E.
Commissioner

Introduction ............................................................3
Synopsis of Four Major Indicators of Environmental Change ......................8
2017 NYC DEP Harbor Survey Monitoring Stations .............................9
NYC DEP Wastewater Treatment Plants and CSOs ............................10
Inner Harbor Water Quality
Bacteria ...........................................................11
Dissolved Oxygen ....................................................12
Chlorophyll ‘a’ .......................................................13
Secchi Transparency ..................................................13
Upper East River – Western Long Island Sound Water Quality
Bacteria ...........................................................14
Dissolved Oxygen ....................................................15
Chlorophyll ‘a’ .......................................................16
Secchi Transparency ..................................................16
Jamaica Bay Water Quality
Bacteria ...........................................................17
Dissolved Oxygen ....................................................18
Chlorophyll ‘a’ .......................................................19
Secchi Transparency ..................................................19
Lower New York Bay – Raritan Bay Water Quality
Bacteria ...........................................................20
Dissolved Oxygen ....................................................21
Chlorophyll ‘a’ .......................................................22
Secchi Transparency ..................................................22
Nitrogen ...............................................................23
Harbor-Wide Improvements ...............................................25
Harbor-Wide Water Quality Improvements
Fecal Coliform .......................................................26
Dissolved Oxygen ....................................................27
Chlorophyll ‘a’ .......................................................28
TABLE OF CONTENTS

2017 New York Harbor Water Quality Report
3
ew York City has monitored the waterways of New
York Harbor for more than a century through its
Harbor Survey Program. The Survey was initiated
in 1909 in response to public outcry over water pollution,
and sought to study the relationship between wastewater
and harbor water quality. By this time, New York Harbor had
long-served as a global hub for commerce and industry
and, due to high levels of pollution and bacteria, had lost
the ability to support wildlife and recreation.
The City would eventually construct 14 wastewater
treatment plants to accommodate a growing population.
The Harbor Survey Program has also since expanded to
include 89 monitoring stations, with 40 located in open
waters and another 49 located in tributaries. The number
of water quality parameters measured has also increased
from just five in 1909, to 27 at present.
As the largest municipal water and wastewater utility in
the country, DEP carries out an expansive environmental
mission to protect waterbodies both in and around New
York, investing billions of dollars in new infrastructure, while
pioneering advancements in wastewater treatment and
resource recovery. Over the last decade, water quality in
New York Harbor has improved to the point that many
waterways are now utilized for recreation and commerce
throughout the year.
WASTEWATER TREATMENT PROCESS
INTRODUCTION
N
Wastewater
Seed Sludge
Primary Sludge
Gravity
Thickener
Anaerobic
Digester
Secondary
Sludge
Primary
Screening
Main
Sewage
Pump
Primary
Settling
Aeration
Tank
Final
Settling
Chlorination
To
Outfall
Sludge
Storage and
Dewatering
Bypass
THE WASTEWATER TREATMENT PROCESS
Newtown Creek
Wastewater Treatment Plant
Located in Brooklyn’s Greenpoint neigh-
borhood, the Newtown Creek Wastewater
Treatment Plant is the largest of New York
City’s 14 wastewater treatment facilities,
situated on 53 acres and serving more
than 1 million people in parts of Brooklyn,
Queens, and Manhattan. On average, the
facility treats about 18% of New York City’s
wastewater, or 310 million gallons each dry
day, with double the capacity when it rains.

4
2017 New York Harbor Water Quality Report
Every day more than 8.6 million New Yorkers
send more than a billion gallons of wastewater
down toilets and drains into New York City’s 7,500
miles of sewer lines and then to one of DEP’s
14 Wastewater Treatment Plants (WWTP).
At WWTPs, physical and biological processes
closely duplicate how wetlands, rivers, streams,
and lakes naturally purify water. While the natural
treatment of wastewater can take weeks, treatment
at a plant is comparatively quick, taking only seven
hours to remove most pollutants.
INVESTING IN OUR INFRASTRUCTURE
New York City, like other older urban communities,
is largely serviced by a combined sewer system
where stormwater that falls on roofs, streets,
and sidewalks, and wastewater from homes and
businesses, are carried through a single sewer line
to treatment plants. The City’s 14 treatment plants
can manage and treat to federal Clean Water Act
standards all the wastewater created in New York
City on a dry weather day, or about 1.3 billion
gallons on average. On a rainy day they have the
capacity to clean more than twice the dry weather
flows. However, during intense precipitation
events, the stormwater that falls on the City’s
impervious surfaces exceeds that capacity and
overflows can be discharged into local waterways,
otherwise known as a Combined Sewer Overflow
(CSO). If the overflows were not discharged, the
City’s treatment plants would be flooded and
severely damaged and wastewater could backup
into homes and businesses.
To reduce CSO’s, DEP has upgraded key
wastewater treatment facilities, expanded and
separated storm sewers, constructed large
CSO retention tanks, and has incorporated the
nation’s largest green infrastructure program to
further mitigate this source of pollution. The city’s
standardized CSO capture rate has risen from
about 30% in 1980, to over 80% today. DEP has
committed $4.1 billion to these projects and has
completed a series of Long Term Control Plans
which commit an additional $4.4 billion to further
mitigate the water quality impact of CSO events.
The remaining part of the City is serviced by the
Municipal Separate Storm Sewer System or MS4.
In MS4 areas, stormwater flows over streets and
other impervious surfaces sweeping up pollutants
such as oils, chemicals, pathogens, and sediments
26th Ward Wastewater Treatment Plant
Earns ASCE Award
The American Society of Civil Engineers (ASCE)
recently named DEP’s 26th Ward Wastewater
Treatment Plant in Brooklyn an “Infrastructure Game
Changer.” The treatment plant is currently undergo-
ing a $150 million upgrade.
New Curbside Rain Gardens Beautify The Bronx
Each rain garden has been specially designed to col-
lect and absorb up to 2,500 gallons of stormwater
each time it rains, or 12 million gallons each year.
This project will ease pressure on the combined
sewer system during heavy rain storms and reduce
overflows into the Hutchinson River.

2017 New York Harbor Water Quality Report
5
and discharging it directly into local waterways.
DEP recently released the NYC Stormwater
Management Plan which describes several
programs to reduce pollution in stormwater runoff
in these areas and further improve water quality
SEPARATING SEWERS
A $132 million project in the College Point
neighborhood of Queens to separate the existing
Combined Sewer System will reduce CSO’s into
the Upper East River and Flushing Bay. The work
includes the construction of more than 400 new
catch basins and nearly 12 miles of new sewers,
allowing for the decommissioning of three existing
combined sewer outfalls. It is estimated that
CSO’s will be reduced by nearly 50 million gallons
annually.
Work is also underway on a $56.5 million project
in the Canarsie neighborhood of Brooklyn that
will include the construction of more than 7
miles of new, high-level storm sewers to collect
stormwater runoff, thereby diverting it from the
existing combined sewer system and improving
the health of Fresh Creek and Jamaica Bay.
Additionally, the Gowanus neighborhood in
Brooklyn is receiving nearly three miles of high
level storm sewers which will create additional
capacity in the neighborhood’s drainage system.
The $52 million project will help to reduce street
flooding and the amount of CSO that may be
discharged into the Gowanus Canal during heavy
rain storms.
CAPTURING STORMWATER
As traditional “grey” infrastructure upgrades have
become increasingly more expensive, DEP has
launched the NYC Green Infrastructure Plan.
An alternative approach to improving harbor
water quality, the plan combines traditional
infrastructure upgrades and the integration
of green infrastructure to capture and retain
stormwater runoff before it can ever enter the
sewer system and contribute to CSOs. DEP will
invest $1.5 billion to build green infrastructure
by 2030.
To date, more than 4,000 rain gardens have
been constructed across the city. In addition to
installing green infrastructure in the public right-
of-way, DEP is also partnering with NYC Parks
Sewer Infrastructure Upgrades
DEP oversees a robust capital plan and is committed
to separating sewers where feasible. This helps to
reduce street flooding and CSO’s, contributing to a
healthier, more resilient New York Harbor.
New Green Playground Opens in Flushing
The Trust for Public Land and New York City unveiled
a state-of-the art “green” playground on a formerly
cracked asphalt lot at the Edward Bleeker School,
JHS 185, in the Flushing neighborhood of Queens.

6
2017 New York Harbor Water Quality Report
and The Trust for Public Land to add stormwater-
capturing green elements such as retention basins,
permeable pavement and trees, to playgrounds
in schoolyards and parks citywide. DEP has
committed more than $50 million to NYC Parks’
Community Parks Initiative and has transformed
more than a dozen asphalt schoolyards into green
playgrounds through The Trust for Public Land’s
Playground Program.
ECOLOGICAL RESTORATION
In addition to improving water quality through
investments in more advanced wastewater
treatment and stormwater management, DEP
has committed to protecting and restoring marine
ecosystems.
In 2016 DEP completed the final phase of a $455
million upgrade of the Paerdegat Basin area which
has already led to significant improvements in
water quality and aesthetics, including restoration
of over 50 acres of native grasslands and wetlands
and the construction of a 5-acre Ecology Park.
Earlier, DEP built and activated a 50-million gallon
CSO retention facility and dredged approximately
23,000 cubic yards of sediment from the bottom
of the Basin.
In the larger Jamaica Bay area, DEP has worked
with partners to restore 142 acres of marsh islands
and over 400 acres of maritime grassland and
forests. Similar wetland restorations have taken
place in Alley Creek, Flushing Bay and even
Newtown Creek.
NITROGEN REDUCTION
Nitrogen is the most common element in the
Earth’s atmosphere. It is a major building block of
plant and animal proteins, as well as a key nutrient
for all types of life. Although it is not a pathogen and
poses no threat to human health, excess nitrogen
can promote the growth of harmful algae and
reduce levels of dissolved oxygen in waterbodies,
limiting the ability of a waterbody to sustain a
healthy ecosystem.
NYC is a regional leader in reducing nitrogen
discharges and following a $1 billion investment
in upgrades at four wastewater treatment plants,
the amount of nitrogen being discharged into the
Upper East River has been reduced by more than
60 percent. These significant upgrades are already
Wetland Restoration in Flushing Bay
Following a sewer upgrade to reduce CSOs and
dredging to eliminate odors, DEP restored more than
three acres of wetlands to improve the ecological
health of Flushing Bay.
Using Oysters as Natural Filters
DEP joined the Billion Oyster Project in 2016 to install
50,000 oysters in Jamaica Bay – the largest single in-
stallation of breeding oysters in New York City.

2017 New York Harbor Water Quality Report
7
contributing to the improvement of the health and
ecology of the East River, Long Island Sound and
New York Harbor.
Work is also underway on a $23 million upgrade to
the Rockaway Wastewater Treatment Plant that will
reduce the amount of nitrogen released into Jamaica
Bay and help to improve the overall ecology of the
waterway. The project is anticipated to be completed
in 2020. This project complements the $460 million
in upgrades that have already been completed to
reduce nitrogen discharges from the Jamaica and
26th Ward Wastewater Treatment Plants, which
similarly drain to Jamaica Bay.
HARBOR WATER QUALITY SURVEY
PROGRAM AND REPORT
In addition to the Harbor Survey Program, the City
has several other water quality monitoring programs
including the Sentinel Monitoring Program, Shoreline
Survey, the Field Sampling and Analysis Program,
and DEP reviews data collected by citizen scientists.
Water quality data collected by DEP scientists in
Summer 2017 will be presented in five sections,
with four delineating each geographic region within
the harbor, and one discussing nitrogen. The water
quality parameters used as indicators of water
quality for this report are bacteria (fecal coliform and
enterococcus), dissolved oxygen, chlorophyll ‘a’ and
Secchi transparency. These parameters and their
relevance are explained in the synopsis that follows.

8
2017 New York Harbor Water Quality Report
Coliform and dissolved oxygen indicators are used in New York State Department of Environmental
Conservation (NYSDEC) standards to quantify ecosystem health or degradation. NYSDEC standards reflect
a range of acceptable water quality conditions corresponding to the State-designated “best usage” of the
water body. Common uses and NYSDEC standards for fecal coliform, enterococcus and dissolved oxygen
are noted in the following chart.
Dissolved Oxygen - The oxygen dissolved in the
water column is critical to respiration in most aquatic
life forms, including fish and invertebrates such as
crabs, clams, and zooplankton. Because oxygen is
essential for much ocean life, dissolved oxygen is one
of the im portant indicators of overall water quality.
Where geography allows, DEP scientists measure
the amount of oxygen dissolved in water at both the
surface and the bottom of the water column.
Bacteria - Concentrations of certain bacteria
are measured as human health-related indica tors
of harbor water quality. DEP scientists measure
concentrations of two groups of bacteria. Fecal
coliform bacteria are found in human and animal
intestines and are associated with wastewater. These
bacteria are widely used to indicate the possible
presence of pathogenic (disease-producing)
bacteria. Enterococci are a subgroup within the fecal
streptococcus group and are distinguished by their
abil ity to survive in salt water. The US Environmental
Protection Agency recommends enterococci as
the best indicator of health risk in salt water used
for recreation. Bac teria counts are calculated as
summer geographic means for May to October.
Secchi Transparency - To estimate the clarity of
surface waters, DEP scientists record the visibility
of Secchi disks lowered into the water. High Secchi
transparency (greater than 5.0 feet) indi cates of clear
water, and reduced transparency is typically due to
high suspended solids concentrations or plankton
blooms. These conditions lead to light-limiting
conditions, which affect primary productivity and
nutrient cycling.
Chlorophyll ‘a’ - Chlorophyll ‘a’ is a green pigment
found in most plants, algae, and phytoplank ton. It is
vital for photosynthesis, which allows plants to obtain
energy from light. It can be used as an indicator of the
health of an aquatic ecosystem’s primary producers,
which are the base of the food chain. Overgrowth
of primary producers can indicate eutrophication,
a high concentration of nutrients like nitro gen and
phosphorus in a body of water. Excess nutrients can
cause high growth rates of phytoplankton and algae,
which can lead to negative secondary impacts like
reduced light penetration, low dissolved oxygen,
and the formation of hypoxic or “dead” zones. In
coastal ecosystems, nitrogen is the limiting nutrient,
so sources of nitrogen discharge are important to
understanding eutrophication in salt water.
SYNOPSIS OF FOUR MAJOR INDICATORS
OF ENVIRONMENTAL CHANGE
COMMON WATER USE AND NYSDEC STANDARDS FOR SALINE WATERS
Class Best Usage of Waters Fecal Coliform
Dissolved Oxygen
(never-less-than)
Enterococcus
SA
Shellfishing and all other
recreational use
No standard 5.0 mg/L N/A
SB
Bathing and other
recreational use
Monthly geometric mean less than
or equal to 200 cells/100 mL from
5 or more samples
5.0 mg/L
(monthly geometric mean) - < 35 Cells / 100mL
(single sample) - Max 104 Cells / 100mL
I
Fishing and Boating
Monthly geometric mean less than
or equal to 2,000 cells/100 mL
from 5 or more samples
4.0 mg/L N/A
SD
Fish survival No standard 3.0 mg/L N/A

2017 New York Harbor Water Quality Report
9
!
!
!
!
!
!
!
!
!
!
!
!
!
!
!
!
!
!
!
!
!
!
!
!
!
!
!
!
!
!
!
!
!
!
!
!
!
!
!
!
!
!
!
!
!
!
!
!
!
!
!
!
!
!
!
!
!
!
!
!
!
!
!
!
!
!
!
!
!
!
!
!
!
!
!
!
!
!
!
!
!
!
!
!
!
!
!
!
!
!
K4
K1
N9
N8
N7
N6
N5
N4
N1
K6
K5
K3
K2
J7
J3
J2
J1
H3
G2
F5
F1
E8
E7
E6
E4
E2
TR1
N3C
TR2
HC3
WC3
WC2
WC1
SP2
SP1
PB3
PB2
NR1
NC3
NC2
NC1
NC0
N9A
N3B
N16
LN1
K5A
JA1
J16
J14
J12
J11
J10
HR2
HR1
GC6
GC5
GC4
GB1
FB1
E15
E14
E13
E12
E11
E10
BR5
BR3
BR1
BB4
AC2
AC1
HR03
FLC2
FLC1
CIC3
CIC2
J9A
HC2
HC
1
GC3
BB2
R a r i t a n
B a y
L o w e r
N e w Y o r k
B a y
U p p e r
N e w Y o r k
B a y
U p p e r E a s t R i v e r
L o n g
I s l a n d
S o u n d
Rockaway
J a m a i c a
B a y
East River
Harlem River
BRONX
QUEENS
MANHATTAN
BROOKLYN
STATEN
ISLAND
NEW
JERSEY
WESTCHESTER
CO
UNTY
!
Open Water
!
(
Triathlon
!
Tributary
Inner Harbor
Jamaica Bay
Lower NY Bay
Upper East River WLIS
0 63
Miles
Kill Van Kull
N
e
w
a
r
k
B
a
y
H
u
d
s
o
n
R
i
v
e
r
A
r
t
h
u
r
K
i
l
l
HOB
TB2
TB1
J15
GHC
Sandy
Hook
ATLANTIC OCEAN
2017 NYC DEP Harbor Survey Monitoring Stations
J5
J8
J18
2017 NYC DEP HARBOR SURVEY MONITORING STATIONS

10
2017 New York Harbor Water Quality Report
!
(
!
(
!
(
!
(
!
(
!
(
!
(
!
(
!
(
!
(
!
(
!
(
!
(
!
(
Jamaica
Rockaway
Red
Hook
Owls
Head
26th
Ward
Bowery
Bay
North
River
Hunts
Point
Wards
Island
Coney
Island
Tallman
Island
Port
Richmond
Oakwood
Beach
Newtown
Creek
R a r i t a n
B a y
L o w e r
N e w Y o r k
B a y
U p p e r
N e w Y o r k
y
B a y
r
H u d s o n R i v e r
U p p e r E a s t R i v e r
L o n g
I s l a n d
S o u n d
Rockaway
J a m a i c a
B a y
Arthur Kill
East River
Harlem River
BRONX
QUEENS
MANHATTAN
BROOKLYN
STATEN
ISLAND
NEW
JERSEY
WESTCHESTER
COUNTY
ATLANTIC OCEAN
NYC DEP Wastewater Pollution Control Plants and CSOs
2017 WWTPs Flow (MGD)
Flow2017
!
(
16 - 50
!
(
51 - 100
!
(
101 - 150
!
(
151 - 250
CSO Outfalls
0 5 102.5
Miles
Kill Van Kull
Sandy
Hook
NYC DEP WASTEWATER TREATMENT PLANTS AND CSOs
Plant
Design
Flow
(MGD)
2017 Average
Daily Flow
(MGD)
Wards Island 275 199
North River 170 109
Hunts Point 200 134
26Th Ward 85 46
Coney Island 110 92
Owls Head 120 94
Newtown Creek 310 211
Red Hook 60 27
Jamaica 100 77
Tallman Island 80 57
Bowery Bay 150 103
Rockaway 45 19
Oakwood Beach 39.9 29.8
Port Richmond 60 25
Total 1804.9 1222.8

2017 New York Harbor Water Quality Report
11
BACTERIA
Water quality as estimated by fecal coliform (FC) concentrations was superior for the Inner Harbor in the
summer of 2017. The regional summer geometric mean was 25 cells/100mL for fecal coliform. All 14 historical/
open-water monitoring sites complied with the monthly FC Bathing Standard of 200 cells/100mL.
Past data has indicated that the Inner Harbor is prone to episodic degradation following rain events due to
additional FC loadings from storm drains and combined sewer overflows (CSOs). Water quality as estimated by
Enterococcus concentrations was also superior for the Inner Harbor in 2017. The regional summer geometric
means was 6 cells/100mL; all 14 historical/open-water monitoring sites had averages < 10 cells/100mL, which
complied with the Bathing Standard of 35 cells/100mL for Enterococcus.
N7
N6
N5
N4
N1
K5
K4
K3
K2
K1
G2
E2
NC3
NC2
NC1
NC0
N3B
GC6
GC5
GC4
GC3
Hudson
River
&
Upper
NY
Bay
N1
NR1
M
North River WWTP
t.
St.
Vincent
N3B West 125th Street
N4 West 42nd Street
N5 Pier A - The Battery
N6 Bell Buoy No. 31
N7 Robbins Reef Buoy No. 28
G2 Gowanus Channel
East River
E2 East 23rd Street
Staten Island
K1 B&O Coal Dock
K2 Shooters Island
K3 B&O Railroad Bridge
K4 Fresh Kills
K5 Tottenville
Newtown Creek
NC0 English Kills
NC1 Amoco Tank Farm
NC2 Maspeth Creek
NC3 Whale Creek
Gowanus Channel
GC3 Union Street Bridge
GC4 Carro
ll Street Bridge
GC5 3rd Street Bridge
GC6 9th Street Bridge
Lower
New York
Bay
QUEENS
BROOKLYN
STATEN ISLAND
BRONX
MANHATTAN
Hudson River
Upper
New York
Bay
Raritan Bay
Jamaica
Bay
Harlem River
East River
Newark Bay
NR1
0 3 61.5
Miles
Water Classi cation
I: Fishing and Boating
SB: Bathing
SD: Fish Survival
Open Water Stations
Tributary Stations
INNER HARBOR
INNER HARBOR WATER QUALITY
The Inner Harbor is defined as the
area including: the Hudson River from
the NYC-Westchester line, through
the Battery to the Verrazano Narrows;
the Lower East River to the Battery;
and the Kill Van Kull-Arthur Kill system.
This area contains 22 Harbor Survey
monitoring stations that have been
grouped together due to common
water uses and functions as well as
similarities in point-source loadings.
Waters of the Inner Harbor are often
continuous, through connecting
branches or straits, and cover a large
and diverse geographic expanse.
Most of the Inner Harbor Area,
excluding the Kills, is classified by
NYSDEC as I, for uses such as fishing
or boating. Most of the area in the
Kills is classified for fish survival only
(SD), with the exception of the far
southern reach of Arthur Kill, which
is designated as Class I. The Hudson
River, from North of Spuyten Duyvil
to Westchester County, is designated
for bathing (SB).

12
2017 New York Harbor Water Quality Report
Fecal coliform levels in the Inner Harbor have
dramatically declined over the last three decades,
with levels since 1992 well below the Bathing
Standards. The averaged FC counts have declined
from levels in the mid-80s that were well in excess
of the standards to the current levels well below
Bathing Standard of 200 cells/100mL. This
improvement has allowed for the opening of Inner
Harbor Waters to most recreational activities. The
progress has been attributed to the cessation of
raw sewage dumping through the full build-out
of New York City’s Wastewater Treatment Plants
(WWTPs), the elimination of illegal discharges into
the water body and the reduction of CSOs.
Enterococcus levels in the Inner Harbor have been
monitored since 2001. The averages for the past
16 years have consistently been well below the
Bathing Standard of 35 cells/100mL.
DISSOLVED OXYGEN
Average summer dissolved oxygen (DO) values in
the Inner Harbor were 6.54 mg/L at the surface
and 6.08 mg/L in bottom waters. Every sampling
station in this region except K3 had at least one
summer sample that fell below the state DO bathing
standard. Sites such as E2, G2, K5 and N3B had
several sub-standard samples. These sites range
from the Hudson River to Arthur Kill and include
the East River and Gowanus Bay. The waters in
this large lower estuary region are generally well
mixed.
One hundred years ago sanitary engineer
Kenneth Allen of the city’s Board of Estimate and
Apportionment published his findings* based
on DO sampling by the Metropolitan Sewerage
Commission which began in 1909. It was
known even then the “value of dissolved oxygen
determinations as a measure of the digestive
capacity of the water and, inversely, of their
pollution...”. Since that time, the implementation
of municipal wastewater treatment facilities
beginning early in the 20th century and the
subsequent upgrading of those facilities to
incorporate secondary treatment have led to
notable improvements in water quality. The gradual
increase since 1970 in average DO levels is a
result of the important steps taken in New York
City after the Clean Water Act in 1972. Since 1992,
no average summer DO value has fallen below the
state’s bathing standard of 5.0 mg/L.
1
10
100
1000
10000
1984 1987 1990 1993 1996 1999 2002 2005 2008 2011 2014 2017
Year
Fecal Coliform Top
Enterococci Top
NYS Bathing Standard for FC
NYS Fishing Standard for FC
NYS Bathing Standard for Enterococci
Fecal Coliform and Enterococci
Inner Harbor Area – Summer Geometric Mean
Counts/100mL
0.00
2.00
4.00
6.00
8.00
10.00
YEAR
Surface Water Bottom Water
Dissolved Oxygen
Inner Harbor Area – Summer Average
NYS Fishing Standard
NYS Bathing Standard
mg/L
*Allen, Kenneth. 1918. Dissolved Oxygen as an Index of the Pollution of New York Harbor. American Journal of Public Health: November 1918, Vol. 8, No. 11, pp. 838-842.

2017 New York Harbor Water Quality Report
13
CHLOROPHYLL ‘A’
The Inner Harbor region encompasses the lower
Hudson River Estuary, the Staten Island Kills as well
as the upper portion of New York Bay. As a result
of this spatial diversity, the physical and chemical
oceanographic conditions which affect chlorophyll
‘a’ in the area also vary widely. A station such as
K5 located at the edge of Raritan Bay averaged
17.3 µg/L of chlorophyll ‘a’ during the summer. At
the opposite edge of the region N1, a brackish water
station, averaged 5.9 µg/L of chlorophyll ‘a’. There is
also great variability during the course of the summer
as phytoplankton blooms intensify and diminish
The 2017 summer chlorophyll ‘a’ average of 6.02 µg/L
was fairly consistent with the past six years’ average. In
fact, since 1986 there are few instances of great yearly
variation in chlorophyll ‘a’. Massive water flow into the
region from the Hudson River has been thought to be
a stabilizing factor. This influx of turbulent river water
also results in a high bottom water average of 33.52
mg/L total suspended solids (TSS).
SECCHI TRANSPARENCY
No official water quality standards exist for the Secchi
transparency. In general, high Secchi readings
(depths of five feet or greater) are associated with
clearer water, while low Secchi numbers (depths
of three feet or less) are indicative of turbid (or light
limiting) waters. In the summer of 2017, the average
Secchi reading was 3.3 feet in the Inner Harbor
area. The marine conditions vary substantially in this
region. N1 in the turbid Hudson River averaged 2.2
ft. Secchi depth while further down the estuary in
Gowanus Bay (G2) the average was 4.8 ft.
Since 2010 there have been consistently lower
Secchi averages in this region. One instance of a
particularly high TSS average in 1996 correlated with
a marked decrease In average Secchi depth. Over
the long term however, there has been little variation
in the Secchi depth averages. This is likely due to the
regular, normal flow from the Hudson River.
0
10
20
30
40
50
60
70
0
10
20
30
40
50
60
70
1985 1989 1993 1997 2001 2005 2009 2013 2017
TSS (mg/L)
Year
Chlorophyll 'a' TSS BottomTSS Top
Chlorophyll 'a' and Total Suspended Solids
Inner Harbor Area – Summer Average
Chlorophyl ‘a’ µg/L
0
10
20
30
40
50
60
70
0
2
4
6
8
10
1985 1989 1993 1997 2001 2005 2009 2013 2017
TSS (mg/L)
Year
Secchi TSS Top TSS Bottom
Secchi Depth and Total Suspended Solids
Inner Harbor Area – Summer Average
Secchi Depth (ft)

14
2017 New York Harbor Water Quality Report
UPPER EAST RIVER – WESTERN LONG ISLAND SOUND
WATER QUALITY
BACTERIA
BACTERIA
In 2017, water quality continued to be superior for the Upper East River-Western Long Island Sound (UER-
WLIS). Fecal Coliform (FC) concentrations for all 11 historical/open-water monitoring sites were in compliance
with their specified ‘best use’ classifications for bathing and fishing. The summer geometric mean for this
region was 24 cells/100mL. Ten out of eleven historical/open-water sites had averages < 100 cells/100mL.
Enterococcus concentrations were also superior for the area in 2017. The regional summer geometric mean was
4 cells/100mL. All 11 monitoring sites in the area complied with the Bathing Standard of 35 cells/100mL.
0 2 41
Miles
Water Classi cation
I: Fishing and Boating
SB: Bathing
SD: Fish Survival
Open Water Stations
Tributary Stations
BR1
BR3
BR5
WC3
WC1
WC2
E6
E14
E13
E4
H3
E15
FB1
FLC2
FLC1
E8
E7
E10
E12
HR03
HR2
E11
AC1
AC2
LN1
East River - Long Island Sound
E4 Hell Gate
E14 Bronx River Mouth
E13 Westchester Creek Buoy N”2”
E11 Little Neck Bay
E12 Eastchester Bay Buoy N”6”
E10 Hart Island
E8 Throgs Neck Bridge
E7 Whitestone Bridge
E6 Flushing Bay
E15 Flushing Creek Mouth
Harlem River
H3 155th Street
Flushing Bay
FB1 Flushing Bay/Creek
FLC2 Flushing Creek Mouth
FLC1 Flushing Creek
Alley Pond Creek
LN1 Little Neck Bay South
AC1 Northern Blvd. Bridge
AC2 Alley Creek Outfall
Bronx River
BR1 233rd St & Bronx Blvd.
BR5 Bronx River Mouth
BR3 Westchester Ave. & Bx River
Hutchinson River & Westchester Creek
HR1 Bartow Ave. Br. & Hutchinson River Pkwy.
HR03
WC1
WC2
WC3
Conner Street Pump Station
Bruckner & Cross Bronx Exps.
South Bound Hutchinson Pkwy.
BUOY “10”
HR2 Boston Rd. Br. & Conner Ave.
BRONX
Hudson
River
Long Island
Sound
Harlem River
Upper East River
Bronx River
Flushing Bay
QUEENS
HR1
THE UPPER EAST RIVER - WESTERN LONG
ISLAND SOUND
The Upper East River–Western
Long Island Sound (UER-WLIS)
represents the northeastern portion
of NY Harbor, from Hell Gate in
the East River, up into the Western
Long Island Sound (WLIS). The
Harbor Survey Program provides
coverage of this area, including the
Harlem River and the East River,
from Roosevelt Island to Hart Island
at the NYC–Westchester County
boundary. This area contains 26
Harbor Survey monitoring stations.
Waters of this vicinity, though
divergent in salinity and depth,
share similarities in pollutant
loadings and are targeted for
management efforts as part of
the Long Island Sound National
Estuary Program.
About half of the Upper East River–
Western Long Island Sound area
is classied as I, for uses such as
shing or boating, with the area east
of the Bronx-Whitestone Bridge
designated for bathing (SB).
2017 New York Harbor Water Quality Report
15
Bacteria concentrations have shown a downward
trend for more than 20 years in the UER-WLIS
region. The recent slight upward tick in the bacteria
levels seems to have more to do with how superior
the waters were the previous seasons than any
systematic change.
Enterococcus levels in the UER-WLIS have been
monitored since 2001. The averages for the past
16 years have been consistently well below the
Bathing Standard.
DISSOLVED OXYGEN
Average summer surface and bottom water DO
values for the UER-WLIS region exceeded the
state bathing standard. However, the 2017 average
here is the lowest of any of the four city regions
(6.15 mg/L and 5.63 mg/L for surface and bottom
waters respectively). Most of the sites included in
this region had one or more samples that were
below the NY state fishing standard of 4.0 mg/L.
H3 in the Harlem River and E12 in western Long
Island Sound had samples that fell below the
bathing standard. Deep water sites such as E10
will commonly yield bottom DO values as low as
2.57 mg/L in the mid and late summer.
The most important trend in this region is the
improvement of bottom waters that hovered near
or below the bathing standard for over 40 years.
Though there was a slight decrease in values
this year, there has been a consistent increase
in average DO values since 2012. Surface water
averages have not been below the bathing
standard since 2004.
1
10
100
1000
10000
1984 1987 1990 1993 1996 1999 2002 2005 2008 2011 2014 2017
Counts/100mL
Year
Fecal Coliform Top
Enterococci Top
Fecal Coliform and Enterococci
Upper East River – Western Long Island Sound
Summer Geometric Mean
NYS Bathing Standard for FC
NYS Fishing Standard for FC
NYS Bathing Standard for Enterococci
0.00
2.00
4.00
6.00
8.00
10.00
YEAR
Surface Water Bottom Water
Dissolved Oxygen
Upper East River – Western Long Island Sound
Summer Average
NYS Fishing Standard
NYS Bathing Standard
mg/L

16
2017 New York Harbor Water Quality Report
0
10
20
30
40
50
60
70
0
2
4
6
8
10
1985 1989 1993 1997 2001 2005 2009 2013 2017
TSS (mg/L)
)tf( htpeD ihcceS
Year
Secchi TSS Top TSS Bottom
Secchi Depth and Total Suspended Solids
Upper East River – Western Long Island Sound
Summer Average
0
10
20
30
40
50
60
70
0
10
20
30
40
50
60
70
1985 1989 1993 1997 2001 2005 2009 2013 2017
TSS (mg/L)
)L/gμ( 'a' llyhporolhC
Year
Chlorophyll 'a' TSS Top TSS Bottom
Chlorophyll 'a' and Total Suspended Solids
Upper East River – Western Long Island Sound
Summer Average
CHLOROPHYLL ‘A’
The stations in the UER-WLIS generally have low
chlorophyll ‘a’ averages (<10 µg/L). Some stations
located in the Long Island Sound bays can average
as high as 26.79 µg/L (E12 Eastchester Bay)
with single samples as high as 92.8 µg/L. E11 in
Littleneck Bay had the next highest average of
17.82 µg/L with samples as high as 53.4 µg/L. The
regional average in this area was a more modest
9.66 µg/L.
Since 2002, the summer regional chlorophyll
‘a’ average has been below 10 µg/L with little
variation. Past and ongoing upgrades to nitrogen
removal processes in each of the four Upper East
River wastewater treatment plants have possibly
resulted in lower chlorophyll ‘a’ averages.
SECCHI TRANSPARENCY
In the summer of 2017, the average Secchi
transparency in the UER-WLIS was 3.5 ft. All of the
open water historical sites in this region averaged
between 3 and 4 feet except H3 (average Secchi
of 2.6 ft.). H3 is located in the Harlem River and
depending on tide receives flow from the turbid
Hudson River.
Average Secchi depths have not varied substantially
since 2009. One noticeable dip in the average
in 1996 coincided with a record high average in
surface and bottom water total suspended solids
and chlorophyll ‘a’ concentration (see figures).
µ

2017 New York Harbor Water Quality Report
17
BACTERIA
In 2017, water quality was superior for Jamaica Bay with summer bacterial geometric means below 200 cells/100mL,
the Bathing Standard for all 12 historical/open-water stations. The regional summer geometric mean for fecal
coliform was 14 cells/100mL.
Under wet weather conditions, the Bay experiences localized degradation. At these times, spikes in FC may
temporarily exceed the Bathing Standard of 200 cells/100mL for the entire northern portion of the Bay. This
decrease in water quality is limited to the Bay proper, as Lower New York Bay waters are not typically affected
by wet weather events.
Enterococcus concentrations were also superior for Jamaica Bay in 2017. The regional summer geometric
mean was 2 cells/100mL; all 12 monitoring sites complied with the Bathing Standard of 35 cells/100mL.
Jamaica Bay Jamaica Bay Interior
Tributaries
PB2 Midway in Paerdegat Basin
PB3 Mouth of Paerdegat Basin
SP1 Spring Creek Under Belt Pkwy Overpass
SP2 Spring Creek
HC1 Hendrix Creek Head
HC
HC3
HOB
2 Hendrix Creek by 26th Ward WTP
BB4
F1
F5
GHC
Mouth of Bergen Basin
Fresh Creek Outfall
Mouth of Fresh Creek
Grass Hassock Channel
BB2 Head of Bergen Basin
J1 Rockaway Inlet
J2 Mill Basin Inlet
J3 Canarsie Pier
J5 Railroad Trestle
J7 Bergen Basin
J1
JA1
N9A
2 Grassy Bay
Jamaica WWTP Outfall
Coney Island Outfall
J11 Sheepshead Bay Mouth
J10 Paerdegat Basin
J9A Fresh Creek Bouy No. C21
J8 Spring Creek
SP2
J8
J7
J3
J2
J1
SP1
PB3
PB2
J9A
J12
J11
HC2
HC3
F1
F5
HC1
J5
N9A
J10
J16
J18
J15
J14
BB2
BB4
GHC
TB1
TB2
HOB
JA1
Jamaica
Bay
Paerdegat Basin
Mill Creek
Thurston
Basin
Fresh Creek
Hendrix Creek
Spring Creek
Shell Bank Basin
Hewtree Basin
East Mill Basin
Mill
Basin
Gerritsen Creek
Shell Bank
Creek
Sheepshead Bay
Rockaway
Inlet
QUEENS
BROOKLYN
Bergen
Basin
0 2 41
Miles
Water Classi cation
Open Water Stations
Tributary Stations
I: Fishing and Boating
SB: Bathing
Jamaica Bay Interior
JAMAICA BAY
West of Broad Channel
Black Wall Channel
Horse Channel
Pumpkin Patch Channel
J14
J15
J16
J18
Hendrix Creek under Belt Pkwy
Head of Bay
TB1
TB2
Thurston Basin
Thurston Basin Mouth
JAMAICA BAY WATER QUALITY
Jamaica Bay is located at the south-
western end of Long Island. This
urban, estuarine embayment and
national park consists primarily of tidal
wetlands, upland areas and open-
waters. The Bay and its drainage
area are almost entirely within the
boroughs of Brooklyn and Queens,
except for a small area at the eastern
end that is in Nassau County. Jamaica
Bay joins the New York Harbor to the
west via the Rockaway Inlet at the
tip of Breezy Point and includes the
Rockaway Peninsula, which forms
the southern limit of the Bay and
separates it from the Atlantic Ocean.
This estuarine water body, consisting
of approximately 20 square miles of
open-water, is covered by 31 Harbor
Survey monitoring stations.
Open waters of Jamaica Bay are
classified for bathing or other
recreational use (SB). Areas within
the Bay’s tributaries and dead-end
canals are prone to reduced water
quality due to direct surface runo
and poor ushing. These areas are
designated for secondary contact use
(I), such as shing or boating.

18
2017 New York Harbor Water Quality Report
Summer geometric mean bacterial levels in
Jamaica Bay as a whole have been below
standards for more than 30 years.
The DEP continues to improve its sewage system.
The operation of CSO storage tanks continues
in two Jamaica Bay tributaries. Additionally, DEP
skimmer vessels work to control floatable debris
in Jamaica Bay, as part of the “Boom and Skim”
program.
DISSOLVED OXYGEN
Of all the city’s regions, Jamaica Bay had the
highest surface water DO summer average (7.37
mg/L). Stations J11, J2, J3, J5, J7, J8, J9A, J12
and JA1 all had several samples that were below
the state bathing DO standard (5.0 mg/L). Stations
J1 and N9A did not have any samples all summer
below that standard. Several sites on the eastern
side of the bay (J8, J12 and JA1) had several
samples below 4.0 mg/L. The stations near the
mouth of the bay generally tend to have better DO
values and the stations in the northern and eastern
sections of the bay have lower values.
After decades of year to year variations in average
summer DO values, it appears there currently is a
small period of stability. From 2013 to 2017, both
surface and bottom water averages have varied
very little. Longer term perspective generally
shows a slight increase in DO averages over time
since the early 1970’s.
1
10
100
1000
10000
1984 1987 1990 1993 1996 1999 2002 2005 2008 2011 2014 2017
Counts/100mL
Year
Fecal Coliform Top
Enterococci Top
Fecal Coliform and Enterococci
Jamaica Bay – Summer Geometric Mean
NYS Bathing Standard for FC
NYS Fishing Standard for FC
NYS Bathing Standard for Enterococci
0.00
2.00
4.00
6.00
8.00
10.00
)L/gm(
YEAR
Surface Water Bottom Water
Dissolved Oxygen
Jamaica Bay – Summer Average
NYS Fishing Standard
NYS Bathing Standard

2017 New York Harbor Water Quality Report
19
CHLOROPHYLL ‘A’
Jamaica Bay typically has the highest chlorophyll ‘a’
averages of all the city’s marine waters. This year was
no exception, with an average of 24.62 µg/L. Only
one open water historical station in Jamaica Bay
(N9A) averaged less than 15 µg/L in 2017. Stations
in the northeastern portion of the Bay (J5, J7, J8,
J12 and JA1) all averaged over 25 µg/L with J12
in Grassy Bay having the highest average of 41.92
µg/L. The stations located at the mouths of various
tributaries in the bay are often eutrophic in summer
months. For example, J7 at the mouth of Bergen
Basin had a summer average of 37.61 µg/L. Slow
turnover of water within the bay and the nutrient-rich
tributaries feeding it allow for the development of
large standing phytoplankton populations.
Average chlorophyll ‘a’ concentrations have
fluctuated greatly over the past 30 years, particularly
in the mid 90s. Since the summer average of 53.91
µg/L in 2001, the concentrations have decreased
gradually. The completed carbon addition facility
(using carbon for Biological Nitrogen Removal
[BNR]) at the 26th Ward Wastewater Treatment
Plant (WWTP) in 2012 was implemented in part to
fulfill a commitment to reducing nitrogen discharges
into Jamaica Bay by more than 50% over 10 years.
In addition to BNR upgrades to 26th Ward, BNR
improvements are progressing at the Jamaica
WWTP, Coney Island WWTP and Rockaway WWTP
in Queens. All BNR improvements are expected to
be completed by 2020.
SECCHI TRANSPARENCY
The 2017 average summer Secchi depth of 3.8 ft.
represented a slight increase from the prior year.
All of the open water historical sites in Jamaica Bay
averaged between 3 and 4 feet except N9A (Secchi
depth of 4.4 ft.). This site is located near the outfall
of the Coney Island WWTP. Often, low individual
Secchi readings are paired with particularly high
chlorophyll ‘a’ concentrations representative of
a phytoplankton bloom. For example at J7, two
instances of Secchi depths of 1.0 ft. were measured
when corresponding chlorophyll ‘a’ samples were
132 µg/L and 149 µg/L.
After 1993, average Secchi depths in Jamaica Bay
have remained fairly stable. Throughout this relatively
stable period, average chlorophyll ‘a’ concentrations
and total suspended solids have varied substantially.
0
10
20
30
40
50
60
70
0
10
20
30
40
50
60
70
1985 1989 1993 1997 2001 2005 2009 2013 2017
TSS (mg/L)
)L/gμ( 'a' llyhporolhC
Year
Chlorophyll 'a' TSS Top TSS Bottom
Chlorophyll 'a' and Total Suspended Solids
Jamaica Bay – Summer Average
0
10
20
30
40
50
60
70
0
2
4
6
8
10
1985 1989 1993 1997 2001 2005 2009 2013 2017
TSS (mg/L)
)tf( htpeD ihcceS
Year
Secchi TSS Top TSS Bottom
Secchi Depth and Total Suspended Solids
Jamaica Bay – Summer Average
20
2017 New York Harbor Water Quality Report
BACTERIA
BACTERIA
In 2017, water quality as estimated by fecal coliform (FC) had the lowest values in the Lower New York Bay-
Raritan Bay (LNYB-RB) as compared to other waterbodies around New York City. Summer geometric mean
for FC numbers show waters of the LNYB-RB meet and surpass NYS Standard of 200 cells/100mL for this
area. All five historical/open-water stations had summer geometric means <= 13 cells/100mL. Their monthly
geometric mean all met standards.
Enterococcus concentrations were also superior for the Lower New York Bay-Raritan Bay in 2017. The regional
summer geometric mean was 2 cells/100mL; all five monitoring sites complied with the Bathing Standard of 35
cells/100mL.
LOWER NEW YORK BAY - RARITAN BAY
N9
N8
K6
N16
K5A
GB1
CIC3
CIC2
Lower New York Bay
K5A Raritan River
K6 Orchard Light
N8 Verrazano Narrows
N9 Steeplechase Pier
N16 Rockaway Point
Coney Island Creek
CIC2 Coney Is Creek
CIC3 Coney Is Creek Mouth
GB1 Gravesend Bay
Lower
New York
Bay
NEW JERSEY
BROOKLYN
STATEN ISLAND
MANHATTAN
ATLANTIC OCEAN
Upper
New York
Bay
Raritan Bay
Arthur Kill
Kill Van Kull
Newark Bay
Hudson River
Water Classi cation
I: Fishing and Boating
SB: Bathing
S
Open Water Stations
Tributary Stations
1
Miles
20 4 6
LOWER NEW YORK BAY – RARITAN BAY
WATER QUALITY
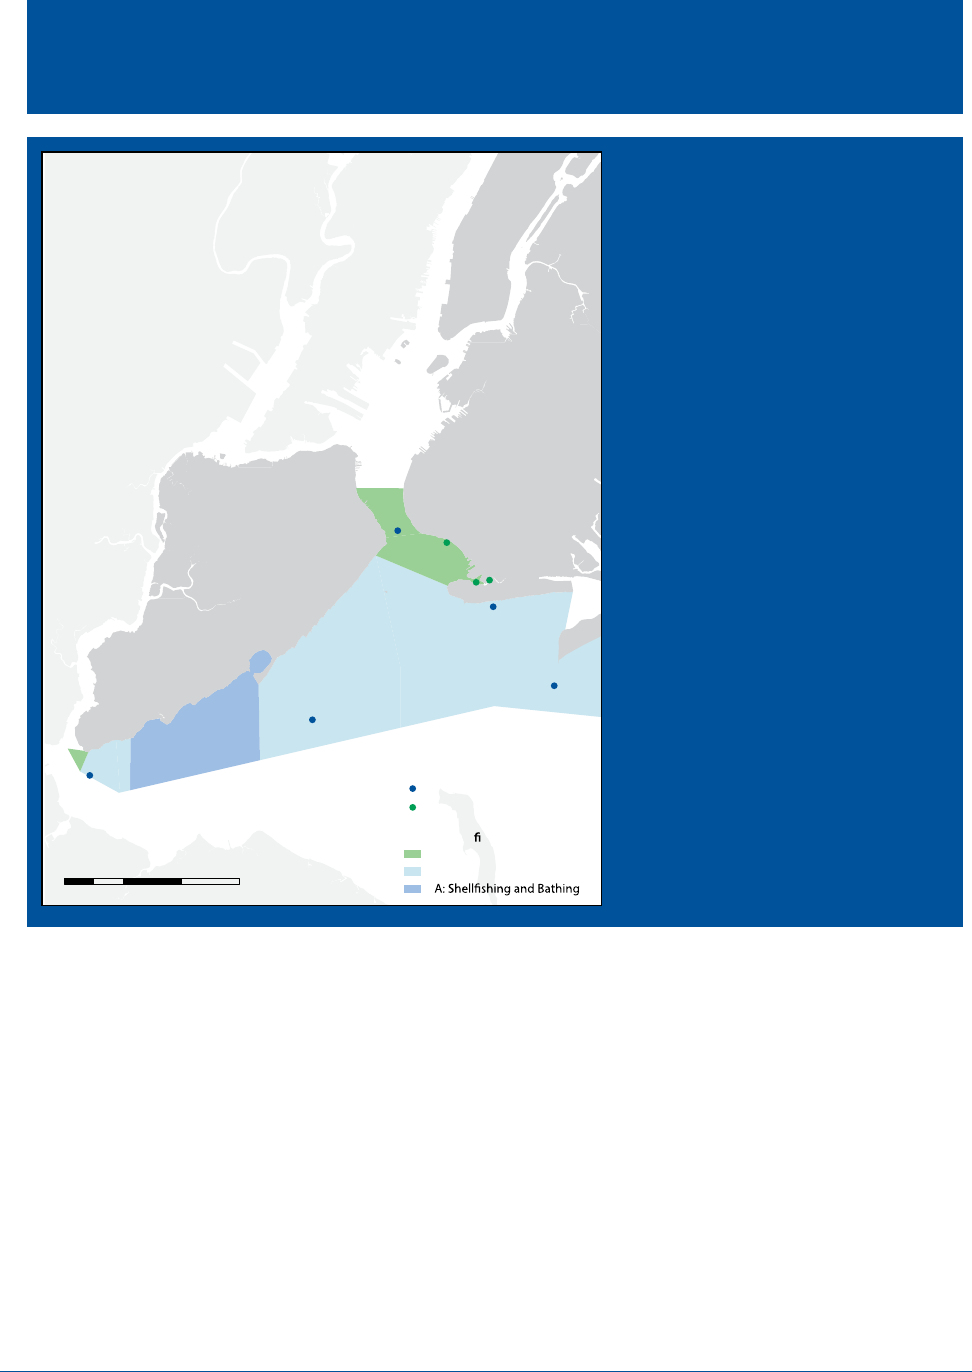
The Lower NY Bay–Raritan Bay
(LNYB-RB) vicinity represents
the most oceanic portion of the
Harbor Survey Program. This area
of 100 square miles is represented
by eight Harbor Survey monitoring
stations and is composed mostly
of open shallow waters, partially
confined by Brooklyn’s Coney
Island to the north, Staten
Island to the north- west, and
New Jersey’s Middlesex and
Monmouth counties and Sandy
Hook to the south. The remainder
of its eastern boundary is open to
Rockaway Inlet and the greater
Atlantic Ocean.
This area of 100 square miles
is represented by eight Harbor
Survey monitoring stations and
has mostly open shallow waters.
Two wastewater treatment plants,
Oakwood Beach and Owls Head,
directly discharge into Lower New
York Bay and Raritan Bay, but the
region’s interconnection with other
parts of the harbor and to the
open water of the Atlantic Ocean
also inuence its water quality.

2017 New York Harbor Water Quality Report
21
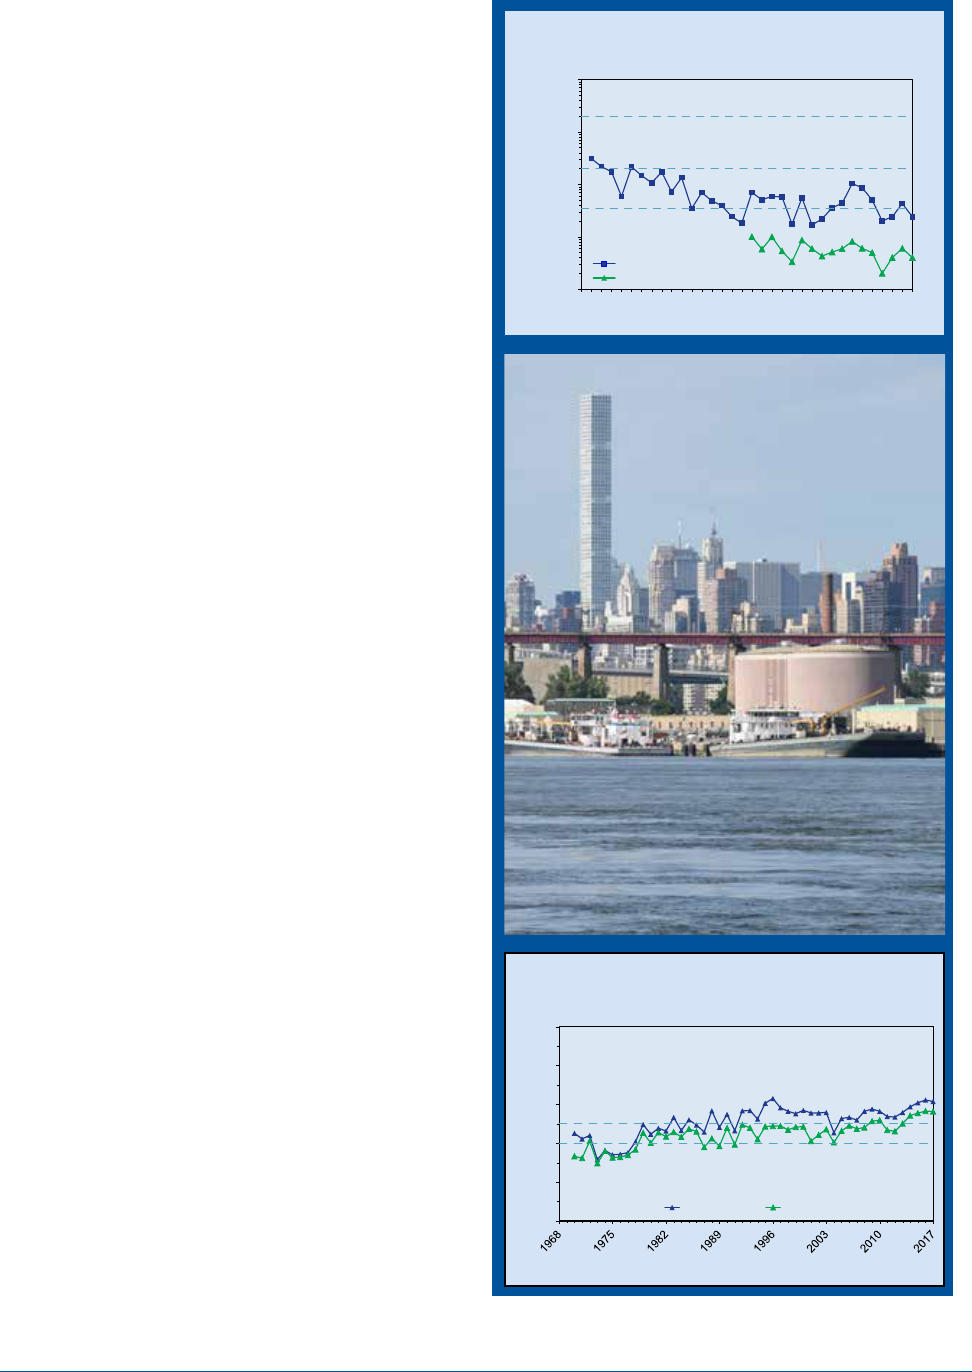
Fecal coliform (FC) concentrations for LNYB-RB
show significant decline from the mid-1980s to the
present time.
These improvements have allowed for the opening
of all NYC public beaches since 1992 and the lifting
of wet weather swimming advisories.
Enterococcus levels in the LNYB-RB have been
consistently well below the Bathing Standard.
DISSOLVED OXYGEN
Average dissolved oxygen values in the LNYB-RB
are relatively high when compared to other regions
(7.17 mg/L and 6.88 mg/l for the surface and bottom
water respectively), partly due to the open water
sites here that are well mixed. The only site with
surface samples below the state’s bathing standard
was K5A in Raritan Bay occurring, as is typical, in
late summer when the water temperatures are high.
Since 1970, most of the improvement in the
LNYB-RB area is attributed to decreased waste
loading into the Arthur Kill and the Raritan River. It
wasn’t until 1979 when the upgrading of secondary
treatment at most of the city’s wastewater
treatment plants (including Oakwood Beach and
Port Richmond) was completed. The Owls Head
Plant was upgraded later. These upgrades are
reflected in the steady rise in average summer
DO values after this time period.
Year
1
10
100
1000
10000
1984 1987 1990 1993 1996 1999 2002 2005 2008 2011 2014 2017
Counts/100mL
Year
Fecal Coliform Top
Enterococci Top
Fecal Coliform and Enterococci
Lower New York Bay – Raritan Bay
Summer Geometric Mean
NYS Bathing Standard for FC
NYS Fishing Standard for FC
NYS Bathing Standard for Enterococci
0.00
2.00
4.00
6.00
8.00
10.00
)L/gm(
YEAR
Surface Water Bottom Water
Dissolved Oxygen
Lower New York Bay – Raritan Bay
Summer Average
NYS Fishing Standard
NYS Bathing Standard

22
2017 New York Harbor Water Quality Report
CHLOROPHYLL ‘A’
This large region is represented by five open water
historical survey stations. The three stations in the
eastern side of the region (Lower Bay) typically
have low average chlorophyll ‘a’ concentrations (all
< 12 µg/L). These waters are among the clearest in
the city and are represented by sampling stations
at the Verrazano Narrows (N8), Coney Island
Beach (N9) and Rockaway Inlet (N16). Conversely,
the Raritan Bay stations on the southeast shore of
Staten Island have higher averages of 16.10 µg/L
(K5A) and 21.23 µg/L (K6)..
Raritan Bay appears to have a natural configuration
ideal for the promotion of phytoplankton blooms
not only in the summer, but in the winter as well.
The relatively shallow area’s main source of fresh
water is the Raritan River, an endangered waterway.
Flushing from the Hudson River is inhibited by
surrounding shoals, such as Old Orchard Shoal.
Tidal exchange with oceanic waters does occur,
but is inhibited somewhat by Sandy Hook.
Given the propensity for algae blooms in Raritan
Bay, this region as a whole still has a history of
having fairly low summer chlorophyll ‘a’ averages.
In fact, over the past 30 years, all but three years
(1995, 1997 and 1998) had averages below
20 µg/L (see figure). In 2017, the chlorophyll ‘a’
average was 12.91 µg/L.
SECCHI TRANSPARENCY
The 2017 average summer Secchi depth in the
LNYB-RB region was 4.2 ft., a decrease from last
year’s average of 4.7 ft. The five sites in this region
mirror the layout described in the Chlorophyll ‘a’
section above. Sites on the eastern side of the
region that have low chlorophyll ‘a’ concentrations
also have high average Secchi depths (4.6 ft. for N9
and 5.4 ft. for N16). N16 is an open water site with
clear ocean water. Raritan Bay stations K6 and K5A
on the other hand, had average Secchi depths of
3.7 and 3.6 ft. respectively.
Though variable on a year to year basis, this region
historically has the highest Secchi depth averages
in the city. One noticeable dip in the Secchi depth
average occurred in the summer of 1995 and was
associated with the region’s highest chlorophyll ‘a’
average and a high TSS average.
0
10
20
30
40
50
60
70
0
10
20
30
40
50
60
70
1985 1989 1993 1997 2001 2005 2009 2013 2017
TSS (mg/L)
( 'a' llyhporolhC μg/L)
Year
Chlorophyll 'a' TSS Top TSS Bottom
Chlorophyll 'a' and Total Suspended Solids
Lower New York Bay – Raritan Bay
Summer Average
0
10
20
30
40
50
60
70
0
2
4
6
8
10
1985 1989 1993 1997 2001 2005 2009 2013 2017
TSS (mg/L)
)tf( htpeD ihcceS
Year
Secchi TSS Top TSS Bottom
Secchi Depth and Total Suspended Solids
Lower New York Bay – Raritan Bay
Summer Average

2017 New York Harbor Water Quality Report
23
NITROGEN
itrogen is the most common element in the
Earth’s atmosphere. It is a major building
block of plant and animal proteins, as well
as a key nutrient for all types of life. Because some
nitrogen-based molecules have nutrient properties,
they are commonly used as fertilizers. However,
excess nitrogen in runoff and wastewater effluent
can promote the growth of harmful algae and reduce
levels of dissolved oxygen, limiting the ability of the
waterbody to sustain a healthy ecosystem.
Nitrogen is not a pathogen and poses no threat to
human health, so the wastewater treatment plants
were not originally designed to remove it from effluent.
In the 1980s, the City and environmental groups grew
concerned about the impact of nitrogen on New York
Harbor, especially as the total nitrogen discharged
was expected to increase due to nationwide changes
in sludge handling laws. In the early 1990s, the City
developed a Nitrogen Control Action Plan to reduce
the total nitrogen discharge into two ecologically
sensitive waterbodies, the Upper East River and
Jamaica Bay. Since 2002, the City has invested $1.2
billion in upgrades to wastewater treatment plants to
remove nitrogen from plant effluent and has allocated
$97 million over the next decade to construct
additional nitrogen control facilities (estimates do
not include costs for future chemical usage during
operations).
NYC DEP has initiated a comprehensive program to
reduce nitrogen discharges to comply with maximum
monthly and twelve month rolling average limits
for Total Nitrogen, and to comply with the special
conditions anticipated under the revised State
Pollution Discharge Elimination System (SPDES)
Permit. The ability to meet these goals is especially
challenging at the WWTPs that perform centralized
sludge dewatering operations. The nitrogen load,
mostly in the form of ammonium, contributed from
the centrate produced during sludge dewatering can
account for as much as 30% of the total nitrogen load
on the secondary treatment system at the WPCP.
The Upper and Lower East River final combined
total nitrogen limit is 12-month rolling average limit
of 44,325 lbs/day. This became effective January
1, 2017. And the current limit for Jamaica Bay as of
August 1, 2017 is a 12-month rolling average of 31,118
lbs/day Total Nitrogen. DEP is also meeting this limit.
After almost 30 years of fluctuating ammonia levels
in Jamaica Bay, there have been three consecutive
years of values below 0.25 mg/L. Nitrate/nitrite levels
N

24
2017 New York Harbor Water Quality Report
here have also remained stable and below 0.20
mg/L since the commencement of the 26th Ward
biological nitrogen reduction program. The inner
harbor currently has the highest nitrogen levels of the
four regions. With one exception, summer means of
ammonia and nitrate/nitrate have remained greater
than 0.30 mg/L. Upper East River nitrogen levels have
dipped slightly since 2012. Several nitrogen removal
0.0
0.1
0.2
0.3
0.4
0.5
0.6
0.7
0.8
1985 1989 1993 1997 2001 2005 2009 2013 2017
NO3 + NO2 & NH3
-N (mg/L)
Year
UER-WLIS
NO32 NH3-N
0.0
0.1
0.2
0.3
0.4
0.5
0.6
0.7
0.8
1985 1989 1993 1997 2001 2005 2009 2013 2017
NO3 + NO2 & NH3
-N (mg/L)
Year
Inner Harbor
NO32 NH3-N
0.0
0.1
0.2
0.3
0.4
0.5
0.6
0.7
0.8
1985 1989 1993 1997 2001 2005 2009 2013 2017
NO3 + NO2 & NH3
-N (mg/L)
Year
Lower NY Bay
NO32 NH3-N
0.0
0.1
0.2
0.3
0.4
0.5
0.6
0.7
0.8
1985 1989 1993 1997 2001 2005 2009 2013 2017
NO3 + NO2 & NH3
-N (mg/L)
Year
Jamaica Bay
NO32 NH3-N
construction projects at plants in this region (including
Hunt’s Point and Ward’s island) were completed
between 2010 and 2014. Lower NY Bay nitrogen
levels have remained relatively low and stable over
the past 30 years. The region has the lowest mean
ammonia concentration in 2017 (0.20 mg/L).

2017 New York Harbor Water Quality Report
25
ater quality conditions in 2017 have remained
stable or have improved slightly. Harbor-
wide summer (May–Oct) average Dissolved
Oxygen (DO) for both surface and bottom waters
remained at record highs, 6.6 mg/L and 6.2 mg/L,
respectively. Fecal Coliform (FC) and Enterococci
summer geometric means were well below the New
York State Department of Environmental Conservation
Standards for bathing and all recreational use (200
cells/100mL for FC and 35 cells/100 mL for Entero).
Chlorophyll ‘a’, Secchi Depth and Total Suspended
Solids in the harbor have remained stable with slight
fluctuations.
During the past half-century, summer average dissolved
oxygen (DO) in the 40 historical/open-water sites of
the New York City harbor have increased from less
than 5.0 to greater than 6.5 mg/L for surface waters
and from less than 4.0 to greater than 6.0 mg/L for
bottom waters. Average DO levels remained above the
NYSDEC Bathing Standard of 5.0 mg/L for the past
26 years.
The harbor-wide summer geometric means for FC
count has decreased and remained below the levels
and within compliance with the NYSDEC Bathing
Standard for the past three decades. All historical/
open-water stations had average FC counts well below
the Bathing Standard in 2017. Most high FC counts with
high geometric means were found in tributaries located
at Coney Island Creek (CIC2), Flushing Creek (FLC1)
and Alley Creek CSO outfall (AC2). Short-term spikes
do occur after rain events due to combined sewer
overflow (CSO) discharges.
Over the last 17 years, harbor-wide Enterococcus
summer geometric means have been relatively stable,
with spikes similar in size and frequency to the fecal
coliform levels. High summer average Enterotocci were
found at Alley Creek CSO outfall (AC2), Alley Creek
mouth (AC1), and Bronx River (BR1).
The NYC DEP’s Long Term Control Plans (LTCP) are
ongoing efforts to begin addressing the effects of CSOs
and stormwater runoff. In the summer of 2017, the
harbor-wide chlorophyll ‘a’ average drop down to 10.1
µg/L from 11.5 µg/L in the past three years; decreased
Secchi depth correlated with both the surface and
bottom Total Suspended Solids’ increasing. The
Harbor Survey has begun its integration with the
LTCPs. There were a total of 86 sites included in the
survey for 2017.
HARBOR-WIDE IMPROVEMENTS
W
0.0
2.0
4.0
6.0
8.0
10.0
Dissolved Oxygen (mg/L)
Year
Harbor - Wide
Dissolved Oxygen
DO Surface
DO Bottom
Fishing Class Stadard
Bathing Class Standard
1
10
100
1000
10000
Bacterial Counts (Cells/100mL)
Year
Harbor - Wide
Bacteria
Fecal Coliform
Enterococci
FC Fishing Standard
FC Bathing Standard
Entero Bathing Standard
0.0
1.0
2.0
3.0
4.0
5.0
6.0
7.0
0
5
10
15
20
25
30
35
40
45
50
55
60
Secchi Depth (ft)
Chlorophyll A (ug/L)
TSS (mg/L)
Year
Harbor - Wide
Chlorophyll A, Secchi
And Total Suspended Solids
Chl A Surface
TSS Surface
TSS Bottom
Secchi Depth

26
2017 New York Harbor Water Quality Report
STATEN
ISLAND
BRO O K LYN
QU E E NS
BRO N X
MAN HATTAN
N E W
J E R S E Y
WESTCHESTER
COUNTY
STATEN
ISLAND
BRO O K LYN
QU E E NS
BRO N X
MAN HATTAN
N E W
J E R S E Y
WESTCHESTER
COUNTY
STATEN
ISLAND
BRO O K LYN
QU E E NS
BRO N X
MAN HATTAN
N E W
J E R S E Y
WESTCHESTER
COUNTY
STATEN
ISLAND
BRO O K LYN
QU E E NS
BRO N X
MAN HATTAN
N E W
J E R S E Y
WESTCHESTER
COUNTY
Fecal Coliform Bacteria
< 100 count/ 100 mL
100 - 200
201 - 2,000
> 2,000
HARBOR-WIDE WATER QUALITY IMPROVEMENTS
OVER FOUR TIME PERIODS
NYS Best-Use Classications: 200 FC/100 mL=SB (Bathing); 2000 FC/100 mL=I (Fishing).
NYC DOH requirements preclude bathing near sewer outfalls and where rainfall may substantially increase coliform levels.
SUMMER GEOMETRIC MEANS FOR FECAL COLIFORM IN SURFACE WATERS
1985 1992
1999
2017
BRONX
QUEENS
MANHATTAN
BROOKLYN
STATEN
ISLAND
NEW
JERSEY
WESTCHESTER
COUNTY
ATLANTIC OCEAN
Fecal Coliform Bacteria
< 100 count/ 100 mL
100 - 200
201 - 2,000
>2,000
2017

2017 New York Harbor Water Quality Report
27
HARBOR-WIDE WATER QUALITY IMPROVEMENTS
OVER FOUR TIME PERIODS
SUMMER AVERAGES FOR DISSOLVED OXYGEN IN BOTTOM WATERS
STATEN
ISLAND
BRO O K LYN
QU E E NS
BRO N X
MAN HATTAN
N E W
J E R S E Y
WESTCHESTER
COUNTY
STATEN
ISLAND
BRO O K LYN
QU E E NS
BRO N X
MAN HATTAN
N E W
J E R S E Y
WESTCHESTER
COUNTY
STATEN
ISLAND
BRO O K LYN
QU E E NS
BRO N X
MAN HATTAN
N E W
J E R S E Y
WESTCHESTER
COUNTY
STATEN
ISLAND
BRO O K LYN
QU E E NS
BRO N X
MAN HATTAN
N E W
J E R S E Y
WESTCHESTER
COUNTY
Dissolved Oxygen
NJriv_mod
< 3.0 mg/L
3.0 - 3.9
4.0 - 4.9
>= 5.0
NYS Best-Use Classications: DO > 5 mg/L=SB (Bathing); DO > 4 mg/L=I (Fishing); DO > 3 mg/L=SD (Fish Survival)
1985 1992
2017
BRONX
MANHATTAN
STATEN
ISLAND
NEW
JERSEY
WESTCHESTER
COUNTY
Dissolved Oxygen
< 3.0 mg/L
3.0 - 3.9
4.0 - 4.9
>= 5.0
1999 2017

28
2017 New York Harbor Water Quality Report
HARBOR-WIDE WATER QUALITY IMPROVEMENTS
OVER FOUR TIME PERIODS
SUMMER AVERAGES FOR CHLOROPHYLL ‘A’ IN SURFACE WATERS
STATEN
ISLAND
BRO O K LYN
QU E E NS
BRO N X
MAN HATTAN
N E W
J E R S E Y
WESTCHESTER
COUNTY
STATEN
ISLAND
BRO O K LYN
QU E E NS
BRO N X
MAN HATTAN
N E W
J E R S E Y
WESTCHESTER
COUNTY
STATEN
ISLAND
BRO O K LYN
QU E E NS
BRO N X
MAN HATTAN
N E W
J E R S E Y
WESTCHESTER
COUNTY
STATEN
ISLAND
BRO O K LYN
QU E E NS
BRO N X
MAN HATTAN
N E W
J E R S E Y
WESTCHESTER
COUNTY
Chlorophyll a
< 10.0 ug/L
10.0 - 19.9
20.0 - 29.9
30.0 - 39.9
40.0 - 49.9
50.0 - 59.9
Chlorophyll ‘a’ > 20 µg/L = Eutrophic conditions
1986 1992
2017
BRONX
QUEENS
MANHATTAN
BROOKLYN
STATEN
ISLAND
NEW
JERSEY
WESTCHESTER
COUNTY
ATLANTIC OCEAN
Chlorophyll 'a'
<10.0 ug/L
10.0 - 19.9
20.0 - 29.9
30.0 - 39.9
40.0 - 49.9
>=50.0
1999 2017

Printed on recycled paper
Visit DEPs website at nyc.gov/dep
and follow NYCWATER on Facebook and Twitter
