
MILLIMAN RESEARCH REPORT
Minimum Dental Loss Ratios:
Considerations and Industry
Analysis
A Discussion of Potential Implications of Massachusetts Initiative Petition
for a Law to Implement Medical Loss Ratios for Dental Benefit Plans
Commissioned by the National Association of Dental Plans
June 2022
Joanne Fontana FSA, MAAA
Tory Carver FSA, MAAA
Ali LaRocco
Gabe Youngblood


MILLIMAN RESEARCH REPORT
Minimum Dental Loss Ratios: Considerations and Industry Analysis 3 June 2022
Table of Contents
SCOPE AND PURPOSE ............................................................................................................................................... 4
EXECUTIVE SUMMARY: KEY FINDINGS ................................................................................................................... 4
BACKGROUND ............................................................................................................................................................. 6
LOSS RATIO BASICS ............................................................................................................................................... 6
MASSACHUSETTS INITIATIVE PETITION BASICS ................................................................................................ 6
RESEARCH AND SUMMARY OF FINDINGS ............................................................................................................... 7
PREVAILING DENTAL LOSS RATIOS ..................................................................................................................... 7
COMMENTARY ON COVID-19 ................................................................................................................................ 9
DISCUSSION AND IMPLICATIONS ........................................................................................................................... 10
WHAT DO THE DENTAL LOSS RATIO STATISTICS TELL US ABOUT POTENTIAL IMPACT OF THE
MASSACHUSETTS INITIATIVE PETITION? .......................................................................................................... 10
WHY MIGHT A MINIMUM DLR RULE RESULT IN PREMIUM INCREASES ON SOME DENTAL POLICIES? ..... 11
VALUE OF REBATES COMPARED WITH ADMINISTRATIVE COST OF REBATE PROGRAM .......................... 13
CAVEATS AND LIMITATIONS ................................................................................................................................... 14
ACKNOWLEDGMENT OF QUALIFICATION .......................................................................................................... 14
APPENDIX 1: 2021 AND 2019 STATUTORY FINANCIAL RESULTS, GROUP AND INDIVIDUAL DENTAL LINES
OF BUSINESS ............................................................................................................................................................. 15

MILLIMAN RESEARCH REPORT
Minimum Dental Loss Ratios: Considerations and Industry Analysis 4 June 2022
Scope and Purpose
Initiative Petition 21-13, “For a Law to Implement Medical Loss Ratios for Dental Benefit Plans” would implement an
83 percent minimum loss ratio on dental benefit plans providing dental care to Massachusetts enrollees. The
proposal would also require dental insurers to issue rebate payments to enrollees should loss ratio requirements not
be met and permits the insurance commissioner to disallow premium rate increases above a particular threshold. To
provide independent research related to this proposal, the National Association of Dental Plans (NADP) engaged
Milliman to review prevailing dental loss ratios, both nationally and in Massachusetts in particular, based on publicly
available information as well as a dental carrier survey conducted by NADP. In addition, NADP asked Milliman to
summarize considerations and potential effects associated with implementation of a dental minimum loss ratio
provision in Massachusetts for various stakeholders including dental plans, policyholders, and providers.
Executive Summary: Key Findings
Milliman documented prevailing industry dental loss ratios from two sources:
• 2021 and 2019 statutory financial statements for all U.S. life or health insurers with a dental line of business;
and
• 2019 Massachusetts dental insurer financial results compiled via a carrier survey conducted by NADP in
April 2021.
We used this information to estimate Dental Loss Ratios (DLRs) consistent with the methodology in the
Massachusetts proposal, and to model the potential effect of a minimum loss ratio on dental premiums and on the
likely magnitude of rebates. Key findings from this work are as follows:
DLRs for Individual/Small Group and Large Group Dental Lines of Business
• The Massachusetts carrier survey, which included financial data for individual/small group segments as well
as large group, indicated that DLRs for individual/small group business were lower than large group DLRs,
and at approximately 68%, they average well below the 83% proposed threshold.
• With a smaller average case size, fixed administrative expenses must be allocated among fewer
policyholders, which tends to result in larger administrative expenses as a proportion of premium than for
blocks of larger cases. Higher administrative expense ratios lead to lower DLRs, and as such, a minimum
loss ratio threshold is more likely to affect the individual and small group markets than the large group
market.
• Notably, the average large group segment loss ratio from the Massachusetts carrier survey, at 79.3%, was
also below the 83% proposed threshold. Large group business tends to have higher loss ratios than for
blocks of smaller sized cases, but even the large size segment’s prevailing average loss ratio would not
comply with the proposal.
• The Massachusetts data is corroborated by broader nationwide financial data, which suggests that 78% of
carriers would have group dental DLRs below the 83% threshold.
DLRs by Carrier Size
• Smaller companies (as defined by revenue) tend to have lower DLRs and would have a relatively more
difficult time meeting the 83% minimum threshold. From the Massachusetts survey respondents, the largest
three insurers averaged almost a 77% DLR, while the smallest three averaged 60%. Similar to the
differentials by line of business just described, smaller dental insurers have fewer policyholders over which
to allocate any fixed costs required to operate the business.
• There is significant overlap in Massachusetts between smaller dental insurers and those focused in the
individual/small group markets. These insurers are the most likely to struggle with the proposed minimum
DLR rule.
• National group dental DLRs indicated a similar relationship between carrier size and DLR, with DLRs
ranging from an average of 81% for the largest 5 reporting carriers down to an average of 65% for the 61
st
through 85
th
largest companies.

MILLIMAN RESEARCH REPORT
Minimum Dental Loss Ratios: Considerations and Industry Analysis 5 June 2022
Modeling of Premiums and Rebates under Massachusetts Initiative Petition
• Under a representative scenario, a smaller carrier or small group and individual market focused carrier
would need to increase premiums by almost 38%, from $35 to over $50, and increase claims by over 60%,
to meet the DLR threshold while retaining enough revenue to administer the business. Increasing premiums
in order to comply could be particularly difficult under the proposal, which allows the state insurance
commissioner to disapprove rate increases above particular thresholds.
• Claims would need to be increased by either:
1. Increasing the plan’s benefits -- potentially beyond what is competitively offered and/or beyond
what consumers desire or want to pay for. Consumers could derive value from increased benefits if
they are interested in paying more for such plans, but otherwise the potential reduction in
availability of more affordable plans could reduce consumer choice.
2. Increasing reimbursement to providers. Paying higher fees to providers alone would increase
provider revenue but dilute the overall value of the dental benefit to consumers due to the
corresponding premium increase.
• Carriers may also eliminate lines of business, such as individual and small group, as administrative
expenses as a percent of premium are higher in these segments, making it harder to meet minimum DLR
thresholds. Another option would be for carriers to discontinue leaner benefit options with lower premiums if
the administrative expenses cannot be funded. These leaner, lower premium options may be appealing to
price-driven consumers who would potentially be left with fewer affordable options.
• Rebates associated with a DLR rule are likely to be small, in some cases below the $20 de minimis
threshold set for medical plans under the ACA. As a comparison, 2020 rebates associated with the
commercial age <65 medical market averaged $205 per person nationwide and $117 per person in
Massachusetts
1
.
• The cost of the process required to calculate, track, and distribute rebates could outweigh the value of the
rebates themselves and could have the effect of pushing DLRs lower due to the increased administrative
burden.
The remainder of this report discusses these findings in more detail and presents the methodologies and
assumptions used in developing the results.
1
https://www.cms.gov/files/document/2020-rebates-state.pdf

MILLIMAN RESEARCH REPORT
Minimum Dental Loss Ratios: Considerations and Industry Analysis 6 June 2022
Background
LOSS RATIO BASICS
Conceptually, a loss ratio represents the proportion of premium directed toward patient care; i.e., how much of each
premium dollar is used to pay health providers for services to plan enrollees. The “traditional” loss ratio calculation is
simply the ratio of claims cost to premium; this general insurance concept is used broadly across all types of
insurance. The Affordable Care Act (ACA) introduced a modified Medical Loss Ratio (MLR) concept for health plans,
allowing taxes and fees to be subtracted from the premium used in the denominator, and allowing quality
improvement expenses to be added to the numerator. ACA MLR reporting occurs using a three-year experience
period, in order to enhance the credibility and stability of the calculation and smooth year-to-year fluctuations. After
an initial phase-in period, the ACA established minimum MLRs of 80% for individual and small group medical plans
and 85% for large group medical plans. Health insurers were required to pay rebates to policyholders within a line of
business whenever the MLR was less than the minimum threshold. Other types of coverage, such as those with a
lower premium basis and those without the obvious quality improvement activities for which managed medical plans
can receive MLR credit, require different loss ratio constructs. In fact, the ACA recognized special lines of business,
such as coverage for citizens living abroad and mini-med plans, as having unique cost structures warranting a
customized or transitional MLR formula. Recognizing the relatively low benefit costs relative to administrative
expenses, and in order to maintain the viability of these products, lower minimum MLR criteria were adopted for these
types of plans
2
.
The ACA did not establish loss ratio minimums for dental plans. In the years since, some states have considered
Dental Loss Ratio (DLR) regulations, notably California’s 2014 law
3
which requires dental carriers to publicly report
annual loss ratio data according to an ACA-style MLR calculation but does not explicitly set a minimum DLR
threshold. In 2021, the state of Maine considered a proposal to implement a DLR, which was ultimately modified to
require dental insurers to provide informational financial reporting instead of implementing a minimum DLR
4
. In
theory, minimum DLR rules should recognize the key differences between dental coverage and medical: the
significantly lower premium base off which to recoup the costs of administering the business, the difficulty in defining
measurable quality improvement activities that would count in the DLR numerator, and the voluntary nature of dental
coverage necessitating a range of price points and coverage levels depending on consumer desires.
MASSACHUSETTS INITIATIVE PETITION BASICS
In the state of Massachusetts, residents may propose initiative petitions for statewide law and constitutional
amendments. The process for submitting an initiative petition differs from the traditional legislative process in that
ultimately the decision to implement the proposed change is voted on by Massachusetts residents during a general
election. Massachusetts procedures require that the Attorney General certify the petition complies with the state’s
constitutional petition requirements. This report discusses the requirements of the Initiative Petition as certified by the
Attorney General and submitted by the Secretary of State to the Clerk of the house of representatives on January 28,
2022
5
.
The Massachusetts initiative petition contains the following key provisions, based on the January 28, 2022 version
provided to the Clerk of the Massachusetts House of Representatives by the Secretary of the Commonwealth:
• An 83% minimum DLR requirement for plans providing dental care services to enrollees in the state, for
plans issued or renewed on or after January 1, 2024.
• A rebate provision under which carriers must rebate members of individual and group dental plans if the loss
ratio is lower than 83%. Rebates must be made to the enrollee for the amount of premium revenue received
by the difference between the minimum loss ratio and the carrier’s DLR.
2
To ease the transition to higher MLR standards for mini-med plans, their MLR numerators were multiplied by 2.00 in 2011, 1.75 in 2012, 1.50 in 2013, and 1.25 starting in
2014, making it easier to pass the minimum MLR. For expatriate plans, the numerator is multiplied by 2.00 in recognition of their higher administrative costs.
3
https://leginfo.legislature.ca.gov/faces/billNavClient.xhtml?bill_id=201320140AB1962
4
http://legislature.maine.gov/legis/bills/getPDF.asp?paper=SP0417&item=1&snum=130
5
https://www.mass.gov/doc/21-13-initiative-petition-for-a-law-to-implement-medical-loss-ratios-for-dental-benefit-plans/download

MILLIMAN RESEARCH REPORT
Minimum Dental Loss Ratios: Considerations and Industry Analysis 7 June 2022
• The petition language states that the DLR shall be calculated following the formula below. This methodology
differs from that proposed in other states and from the formula used for MLR calculation under the ACA as it
does not allow for the subtraction of federal and state taxes, licensing, and regulatory fees from the
denominator. Without the ability to subtract these items in the calculation, carriers will have relatively more
difficulty reaching the proposed 83% loss ratio. One consequence of this formula is that future increases in
taxes and fees would leverage fully onto the amount of revenue available for dental plan administration
expense while meeting the minimum DLR.
reimbursement for clinical dental services
premium revenue
Research and Summary of Findings
PREVAILING DENTAL LOSS RATIOS
To understand the potential impact of this bill, Milliman documented prevailing industry dental loss ratios from two
sources:
• 2021 and 2019 statutory financial statements for all U.S. life or health insurers with dental specific financial
data available
6
;
• 2019 Massachusetts dental insurer financial results compiled via a carrier survey conducted by NADP in
April 2021
Dental Insurer Financial Statement Filings
We used the S&P Global database to compile publicly available 2021 and 2019 statutory financial statements for all
U.S. life or health insurers reporting results for the commercial dental line of business. The data is aggregated to
entity levels (rather than statutory company levels), as defined by S&P Global. The financial information from these
statements is national, not specific to Massachusetts. The financial data is shown separately for Group Dental and
Individual Dental lines of business in Table 1. We have summarized results by descending dental book of business
revenue, to illustrate the different DLRs by size of the insurer’s dental block. Reading up from the bottom of each
chart, you see that as plan size increases, DLR also tends to increase due to emerging economies of scale, reducing
administrative cost as a percent of premium. In 2021, we observed that the largest company in the individual market
appeared to allow that market segment to operate at a loss, which may not be sustainable for organizations with
smaller scope of operations or a greater proportion of their business in the individual segment. Company-specific loss
ratios vary widely; detail for all companies is shown as a scatterplot in Appendix 1. We included 2019 statutory
financial results as confirmation that 2021 results were not significantly affected by the continuing COVID-19
pandemic.
6
National data Source: National Association of Insurance Commissioners. Annual Statement Database, as delivered by S&P Global, Inc. All Rights Reserved.

MILLIMAN RESEARCH REPORT
Minimum Dental Loss Ratios: Considerations and Industry Analysis 8 June 2022
TABLE 1A. 2021 STATUTORY FINANCIAL RESULTS FOR COMMERCIAL DENTAL INSURERS – NATIONAL**
TABLE 1B. 2019 STATUTORY FINANCIAL RESULTS FOR COMMERCIAL DENTAL INSURERS – NATIONAL**
**National data includes carriers that are grouped at an entity level, as defined by S&P Global.
Company Size
(based on revenue)
Member-
months
Revenue Claims
Total 651,436 $11,596,068 $9,172,851 79.1% 78 61
Top 1 to 5 452,457 $5,735,880 $4,637,617 80.9% 5 4
Top 6 to 10 41,373 $1,622,126 $1,270,192 78.3% 5 5
Top 11 to 20 62,608 $1,875,162 $1,462,901 78.0% 10 7
Top 21 to 40 74,707 $1,873,130 $1,436,595 76.7% 20 15
Top 41 to 60 18,474 $432,241 $328,217 75.9% 20 17
Top 61 to 78 1,817 $57,530 $37,328 64.9% 18 13
Company Size
(based on revenue)
Member-
months
Revenue Claims
Total 83,541 $2,077,089 $1,530,543 73.7% 55 45
Top 1 to 5 63,234 $1,336,806 $1,008,184 75.4% 5 4
Top 6 to 10 7,600 $261,274 $193,223 74.0% 5 5
Top 11 to 20 7,413 $283,337 $199,058 70.3% 10 7
Top 21 to 40 4,534 $174,754 $116,089 66.4% 20 17
Top 41 to 55 760 $20,917 $13,988 66.9% 15 12
2019 Group Dental Line of Business
Totals (in 000s)
Dental
Loss Ratio =
Claims/Revenue
# Companies
in Bucket
# with
Estimated
DLR < 83%
2019 Individual Dental Line of Business
Totals (in 000s)
Dental
Loss Ratio =
Claims/Revenue
# Companies
in Bucket
# with
Estimated
DLR < 83%

MILLIMAN RESEARCH REPORT
Minimum Dental Loss Ratios: Considerations and Industry Analysis 9 June 2022
NADP Survey of Dental Carriers in Massachusetts
We also compiled loss ratio statistics specific to Massachusetts based on a survey of dental insurers operating in the
state conducted by NADP in April 2021. Ten carriers operating in Massachusetts including major national as well as
smaller regional dental insurers responded to the survey, and NADP provided Milliman anonymized results for
analysis. Respondents summarized financial metrics separately for the large group, small group, and individual
dental markets; we calculated estimated DLR (claims/premium). The compiled results for large group and combined
small group/individual markets are shown in Table 2.
TABLE 2. 2019 FINANCIAL RESULTS FOR COMMERCIAL DENTAL INSURERS - MASSACHUSETTS
Similar to the above national statistics, we also summarized DLRs, using methodology consistent with the
Massachusetts proposal, according to the size of the carrier’s book of business as measured by premium revenue in
the state.
TABLE 3. 2019 DLRs FOR MASSACHUSETTS COMMERCIAL DENTAL INSURERS, BY CARRIER SIZE
COMMENTARY ON COVID-19
We based our national market study on 2021 financial results. Because the COVID-19 pandemic continued into
2021, we also reviewed 2019 financial results for comparability, to ensure that 2021 results were a reasonable basis
for analysis. We found that loss ratio levels as well as patterns by company size were broadly consistent between
2019 and 2021. The national statutory financial results from 2019 and 2021 are contained in the appendices to this
report.
For the NADP carrier survey, 2019 data was collected and used in this report. 2020 data was not used because of
the significant impact of COVID-19 on the dental market during that time period, and 2021 data was not available as
of the time of the NADP survey request.

MILLIMAN RESEARCH REPORT
Minimum Dental Loss Ratios: Considerations and Industry Analysis 10 June 2022
Discussion and Implications
WHAT DO THE DENTAL LOSS RATIO STATISTICS TELL US ABOUT POTENTIAL IMPACT OF THE
MASSACHUSETTS INITIATIVE PETITION?
Both the national statistics from statutory financial statements and the Massachusetts-specific statistics from the
NADP carrier survey tell a similar story.
1. National industry DLRs for group dental insurers average around 80% in total, with results varying
by insurer; few dental carriers operate at or above the proposed 83% minimum DLR.
The nationwide financial data in Table 1 suggests that overall, 66/85 or 78% of carriers would have group
dental DLRs below the 83% threshold. On average, smaller dental carriers and/or those focused on the
individual/small group markets would be more likely to have difficulty attaining the minimum DLR, while
larger, multi-line, or nationwide dental insurers, and insurers focused on the large group dental line of
business, are less likely to have difficulty. That being said, there were carriers across the size spectrum
with DLRs below 83%. Based on the Massachusetts data from the carrier survey, the prevailing average
loss ratio is 75.9%, again with lower loss ratios for smaller companies and for companies focused on
smaller case sizes.
2. The majority of DLRs in the individual and small group dental market average well below the 83%
threshold. Dental insurers with blocks of business more heavily focused in the small group and/or
individual segments may have a more difficult time reaching an 83% DLR.
The majority of national individual market participants also operate at dental loss ratios below the proposed
threshold, and in Massachusetts specifically, the NADP carrier survey results suggest an average DLR of
68.2% for individual/small group markets, which is well below 83%. With a smaller average case size in the
individual/small group markets, fixed administrative expenses must be allocated among fewer
policyholders, which tends to result in administrative expenses comprising a larger portion of premium than
for blocks of larger cases. This is borne out in the Massachusetts survey results; as shown in Table 4, the
small group/individual lines of business show much higher administrative costs as a percentage of
premium.
TABLE 4. 2019 ADMINSTRATIVE EXPENSE RATIOS AND PROFIT MARGIN
FOR COMMERCIAL DENTAL INSURERS - MASSACHUSETTS
Higher administrative expense ratios lead to lower DLRs, and as such, a minimum loss ratio threshold is
more likely to affect the individual and small group markets. Furthermore, it does not appear that loss ratio
minimums could be achieved in the individual or small group markets by reducing margin as profit margins
are low across the board in Massachusetts.
3. Smaller companies (as defined by revenue) tend to have lower DLRs and would have a more
difficult time meeting the 83% minimum threshold.
While some large national dental carriers operate closer to an 83% DLR, Table 1 and Table 3 clearly show
that smaller dental companies operate at lower DLRs on average, both on a nationwide basis and in
Massachusetts’ dental market. National group dental DLRs show a downward trend as company size
(measured by revenue) declines. From the Massachusetts survey respondents, the largest three insurers
averaged a 76.7% DLR, while the smallest three averaged 60.4%. Similar to the differentials by line of
business just described, smaller dental insurers have fewer policyholders over which to allocate any fixed
costs required to operate the business.

MILLIMAN RESEARCH REPORT
Minimum Dental Loss Ratios: Considerations and Industry Analysis 11 June 2022
4. There is significant overlap in Massachusetts between smaller dental insurers and those focused in
the individual/small group markets. These insurers are the most likely to struggle with a minimum
DLR rule.
Table 5 shows that Carriers 8-10 in the survey, the smallest 3 responding carriers by revenue, generate
more than half of their dental revenue from the individual and small group lines of business and a far
greater proportion than larger insurers.
TABLE 5. OVERLAP BETWEEN CARRIER SIZE AND
PROPORTION OF REVENUE FROM INDIVIDUAL AND SMALL GROUP MARKET
The insurers most affected by a minimum loss ratio provision may determine that protective actions such as
increasing premiums, exiting unprofitable segments, or exiting the Massachusetts dental insurance market
are necessary. Options for compliance with minimum DLR requirements may be more limited for locally
focused insurers that lack presence in other states, other dental lines of business, or other insurance lines,
with premium increases being the most obvious option. Raising premiums may not be a viable option for
insurers in Massachusetts under the current proposal. Section (d) of the initiative petition directs the
insurance commissioner to disapprove any filed rate increase above a certain percentage. This provision
could effectively prohibit insurers from obtaining premium increases to maintain administrative capabilities
and achieve the proposed 83% loss ratio threshold.
WHY MIGHT A MINIMUM DLR RULE RESULT IN PREMIUM INCREASES ON SOME DENTAL POLICIES?
As demonstrated above, dental insurers in Massachusetts, across all markets (large group, small group, and
individual) and of varying sizes (large and small insurers based on revenue) are not currently operating at the
proposed DLR and will be affected by a minimum DLR requirement. To continue operating, dental carriers must
generate enough in dental premium dollars to pay dental claims and administer the policies while complying with the
minimum DLR. With the DLR minimum significantly above the prevailing level for the smallest insurers or those
operating in the individual and small group markets, they will have to make cost structure changes in order to comply.
Given that large savings in administrative expenses are unlikely, carriers could lower their profit margins or increase
claims payments to providers, either via greater covered services for policyholders or increases in provider fees, in
order to achieve the required relationship among claim costs, administrative and other non-claims costs, and
premiums which a minimum DLR implies. Furthermore, dental coverage is a voluntary benefit that currently includes
a wide variety of benefit levels to meet the preferences of different individuals and employers. A potential outcome of
a high minimum DLR is that lower premium plans with leaner benefits may no longer be offered, potentially reducing
consumer choice in dental plans designs.
We illustrate these counterbalancing effects with a simple example using a representative medium dental insurer
focused on smaller groups and individual coverage, with an assumed current DLR of 70%, an administrative expense
ratio of 23%, profit of 5%, and average premiums of $38 per member per month (PMPM). This insurer currently
spends 23% x $38 = $8.75 PMPM on administration.

MILLIMAN RESEARCH REPORT
Minimum Dental Loss Ratios: Considerations and Industry Analysis 12 June 2022
Table 6 illustrates potential financial outcome scenarios for this hypothetical insurer under the 83% DLR proposed by
the Massachusetts Initiative Petition.
TABLE 6. 83% DLR IMPACT ANALYSIS ON SAMPLE MEDIUM DENTAL INSURER
The scenarios summarized in Table 6 are as follows:
• In Scenario 1, we simply apply the 83% DLR with no other changes to the insurer’s cost structure.
Compliance with the higher DLR requires the carrier to reduce premiums but leaves them with a loss of
12.3%.
• Scenario 2 assumes that the insurer is able to improve administrative efficiency by 10%, reducing the PMPM
administration cost to $7.88 PMPM. Once the 83% DLR is applied, this scenario results in a loss of 9.6%,
indicating that even with measurable efficiency improvements, the carrier may find it impossible to operate
under the proposed threshold.
• In Scenario 3, we assume that the insurer increases premiums enough so that after claims payment, $7.88
PMPM administrative expenses, and taxes and fees, the insurer breaks even. In order to make this happen,
premiums must increase by 38%, from $35 to over $50, and claims must be increased by over 63%, from
$26.60 to $43.58. Claims would need to be increased by either increasing the plan’s benefits -- potentially
beyond what is competitively offered and/or beyond what consumers desire or want to pay for -- or by
increasing reimbursement to providers. This potential result of premium increases via higher than
necessary benefits or higher payments to dentists seems counter to the intent of the DLR regulation to
“increase the value of dental insurance”.
The simplified scenarios do not account for other potential barriers to sustaining an 83% DLR. For example, we did
not attempt to model potential loss of membership; if employer groups or individuals seek lower cost plans from other
insurers in the market, affected companies could lose market share, further eroding their ability to spread fixed
administrative costs, and deteriorating their competitive position. Based on these dynamics, we expect that the
implementation of an 83% minimum DLR would primarily affect individual and small group dental plans, as well as
smaller dental insurers focused on those markets.
Rate Increases under the proposal in Massachusetts
While rate increases via increased benefits or increased provider reimbursement are one potential response by
insurers required to comply with a minimum loss ratio rule, section (d) of the initiative petition may make that difficult
for insures to implement. As mentioned above, section (d)’s language allows the commissioner to disapprove
requested rate increases under certain conditions. This may leave carriers with fewer options for continuing to offer
dental benefit to Massachusetts enrollees, and could result in carriers exiting the Massachusetts markets, thus
decreasing consumer choice and/or leading to carrier consolidation.
Scenario 3 shown in Table 6 presumes that insurers are able to adjust premiums in order to comply with the minimum
loss ratio. If insurers are not permitted to adjust premiums due to the provisions in section (d) of the initiative petition,
then Scenario 3 would not be possible, and insurers would be more likely to be relegated to scenarios resembling 1
and 2, operating at a significant loss.

MILLIMAN RESEARCH REPORT
Minimum Dental Loss Ratios: Considerations and Industry Analysis 13 June 2022
VALUE OF REBATES COMPARED WITH ADMINISTRATIVE COST OF REBATE PROGRAM
Rebate provisions in minimum loss ratio rules are intended to ensure that the end consumer receives remuneration
when insurers operate at a loss ratio lower than the minimum threshold. In recognition of the administrative burden
associated with the rebating process, medical minimum loss ratio regulations include measures such as (1) a de
minimis rebate threshold of $20 below which policyholder rebates are not required, (2) the ability to credit the rebate
toward future premium payments instead of issuing many small rebate checks, and (3) the ability to pay a lump sum
rebate to the group policyholder instead of individual rebates to each employee.
The Massachusetts initiative petition contemplates rebates for individual and group dental plans if the loss ratio is
lower than 83%; rebates must be made to the enrollee for the amount of premium revenue received multiplied by the
difference between the minimum loss ratio and the carrier’s DLR.
While 2020 rebates associated with the medical market in the commercial age <65 market averaged $205 per person
nationwide and $117 per person in Massachusetts
7
, rebates associated with a DLR rule are likely to be small, often
below the $20 de minimis threshold set for medical plans. Furthermore, the cost of the process required to calculate,
track, and distribute rebates could outweigh the value of the rebates themselves and could have the effect of pushing
DLR lower due to the increased administrative burden.
To illustrate the potential magnitude of rebates under the Massachusetts initiative petition, we developed illustrative
scenarios based loosely on the Massachusetts market results. We used two different assumed premium levels: (1)
based on the assumptions for the sample medium dental carrier from Table 6, and (2) a lower premium
representative of a larger carrier or large group focused carrier. We calculated annual rebates under various actual
DLR scenarios that would necessitate a rebate under the proposal. Rebates are small, particularly compared to
medical rebates, even for carriers with DLRs well below the 83% threshold; and, for carriers with a DLR above
approximately 78%, the rebates are likely to fall below the ACA medical $20 de minimis threshold. The de minimis
rebate level was set to avoid undue administrative burden on health insurers. Dental insurers would face the same
administrative tasks in managing a rebate program, with far greater administrative cost pressure due to the smaller
premium over which to recoup those administrative costs, for considerably less financial benefit to consumers.
TABLE 7. ILLUSTRATIVE REBATE CALCULATIONS
7
https://www.cms.gov/files/document/2020-rebates-state.pdf
Illustrative Rebate Calculation @ 76% DLR @ 78% DLR
@ DLR that produces
$20 annual rebate
@ 80% DLR @ 82% DLR
PMPM Premium $38.00 $38.00 $38.00 $38.00 $38.00
Assumed DLR
76.00% 78.00% 78.61% 80.00% 82.00%
Minimum DLR 83.00% 83.00% 83.00% 83.00% 83.00%
Calculated Annual Rebate
$31.92 $22.80 $20.00 $13.68 $4.56
PMPM Premium $33.00 $33.00 $33.00 $33.00 $33.00
Assumed DLR
76.00% 78.00% 77.95% 80.00% 82.00%
Minimum DLR 83.00% 83.00% 83.00% 83.00% 83.00%
Calculated Annual Rebate*
$27.72 $19.80 $20.00 $11.88 $3.96

MILLIMAN RESEARCH REPORT
Minimum Dental Loss Ratios: Considerations and Industry Analysis 14 June 2022
Caveats and Limitations
This Milliman report has been prepared for the specific purpose of providing NADP with research and analysis related
to dental loss ratios to aid in understanding the potential impact of minimum loss ratio legislation being considered in
Massachusetts. This information may not be appropriate, and should not be used, for any other purpose.
This report has been prepared for NADP. NADP may share this information with outside entities with Milliman’s
permission. Milliman does not intend to benefit, and assumes no duty or liability to, other parties who receive this
work product. Any third party recipient of this work product who desires professional guidance should not rely upon
Milliman’s work product, but should engage qualified professionals for advice appropriate to its own specific needs.
Any releases of this report to a third party should be in its entirety. This report must be read in its entirety and
specialized knowledge of the industry is necessary to fully understand the report and its conclusions.
The results presented herein are estimates based on carefully constructed actuarial models. Differences between
our estimates and actual amounts depend on the extent to which future experience conforms to the assumptions
made for this analysis. It is certain that actual experience will not conform exactly to the assumptions used in this
analysis. Actual amounts will differ from projected amounts to the extent that actual experience deviates from
expected experience.
The illustrations presented in this report do not mimic the actual experience of any particular dental plan. They are
meant to demonstrate the mechanics of complying with minimum loss ratio rules while maintaining a specified
administrative expense structure, and the implications to claim costs and premiums of doing so. It is important to
note that results will differ if the starting assumptions differ, or if other levers aside from provider compensation or
profit are adjusted (e.g. if commissions are altered in response to an increased loss ratio requirement).
In performing this analysis, we relied on data and other information provided by NADP. We have not audited or
verified this data and other information but reviewed it for general reasonableness. If the underlying data or
information is inaccurate or incomplete, the results of our analysis may likewise be inaccurate or incomplete.
The material in this report represents the opinion of the author and is not representative of the views of Milliman.
Milliman is not advocating for, or endorsing, any specific views in this report related to minimum DLR requirements.
Milliman does not provide legal advice, and recommends that NADP consult with its legal advisors regarding legal
matters.
The terms of Milliman’s Consulting Services Agreement with NADP signed on March 24, 2011 apply to this report and
its use.
ACKNOWLEDGMENT OF QUALIFICATION
We, Joanne Fontana and Tory Carver, are actuaries for Milliman. We are members of the American Academy of
Actuaries and meet the Qualification Standards of the American Academy of Actuaries to render the actuarial opinion
contained herein.

MILLIMAN RESEARCH REPORT
Minimum Dental Loss Ratios: Considerations and Industry Analysis 15 June 2022
Appendix 1: 2021 and 2019 Statutory Financial Results,
Group and Individual Dental Lines of Business
8
1A: 2021 National Statutory Financial Results for Commercial Dental Insurers – Group Line of Business
1B: 2019 National Statutory Financial Results for Commercial Dental Insurers – Group Line of Business
(for display purposes one company’s results with 304M members and 73.6% loss ratio was removed from graph)
8
National data Source: National Association of Insurance Commissioners. Annual Statement Database, as delivered by S&P Global, Inc. All Rights Reserved.
MILLIMAN RESEARCH REPORT
Minimum Dental Loss Ratios: Considerations and Industry Analysis 16 June 2022
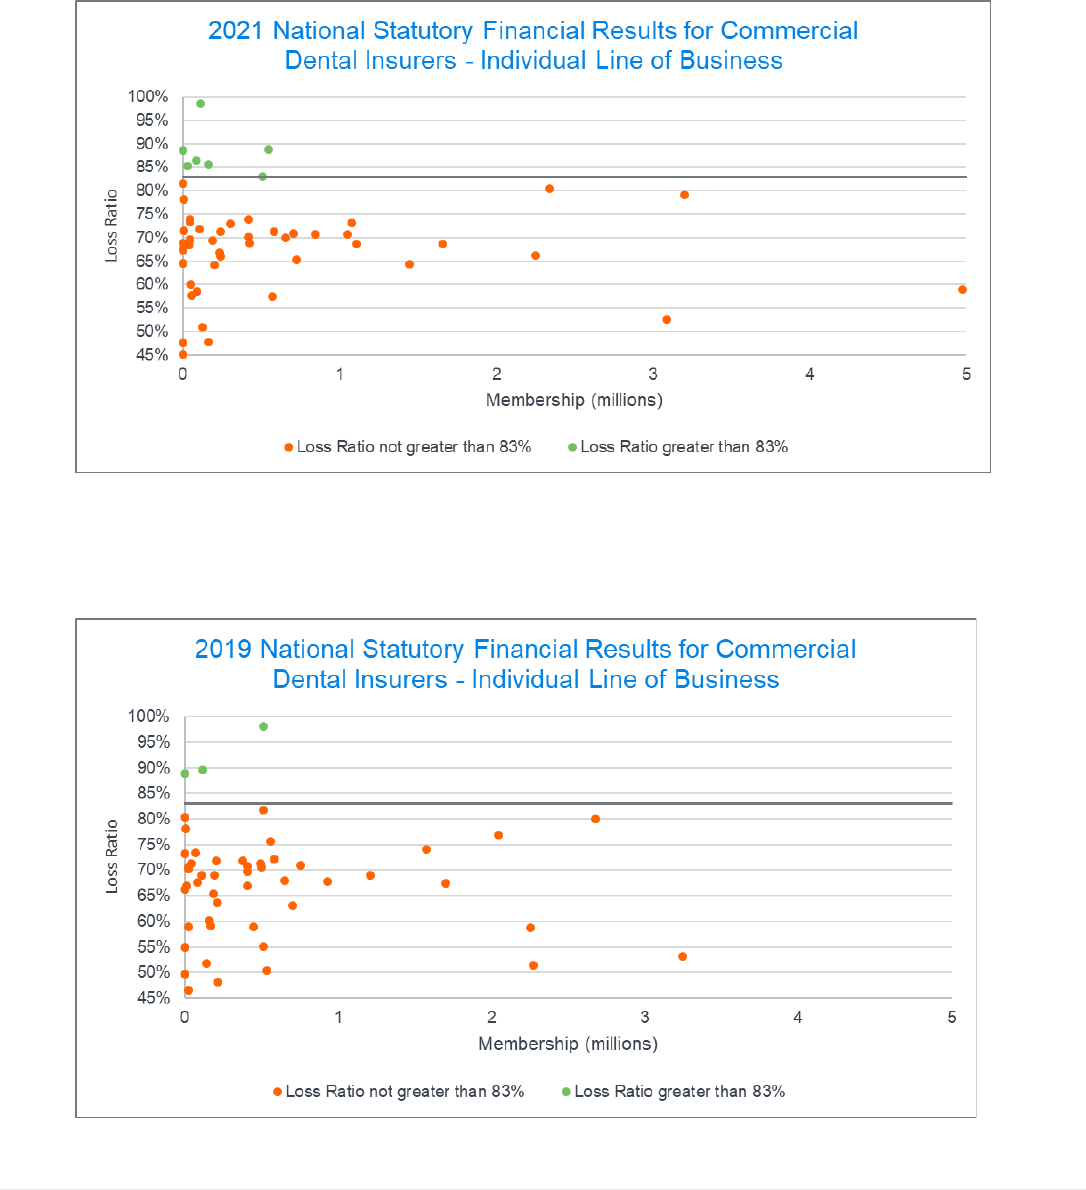
1C: 2021 National Statutory Financial Results for Commercial Dental Insurers – Individual Line of Business
for display purposes the following company results were removed from graph:
Membership (millions)
Loss Ratio
44.2
83.7%
42.4
129.9%
8.1
50.8%
1D: 2019 National Statutory Financial Results for Commercial Dental Insurers – Individual Line of Business
for display purposes the following company results were removed from graph:
Membership (millions)
Loss Ratio
46.5
83.0%
8.5
53.3%
