
CONSUMER FINANCIAL PROTECTION BUREAU | MARCH 2020
Market Snapshot:
First-time Homebuyers
Table of contents
Table of contents.........................................................................................................1
1. Introduction...........................................................................................................2
2. Data........................................................................................................................3
3. First-time homebuyer analysis............................................................................4
4. Conclusion ..........................................................................................................16
MARKET SNAPSHOT: FIRST-TIME HOMEBUYERS 1

1. Introduction
1
Most American households desire to own a home.
2
However, for households attempting to
make the transition from renting to owning, shifts in the housing and mortgage markets can
play a large role in whether they can afford to buy a home. Unlike most repeat buyers, first-time
buyers do not have the benefit of accumulated home equity or an existing investment that
generally insulates homeowners from rising housing costs. As a result, rising home values can
disproportionately affect first-time buyers. Additionally, renters do not benefit from a credit
history that reflects monthly mortgage payments, and many times their rental history will not be
reflected in their credit history either.
In this Market Snapshot, we investigate the prevalence and ease of first-time homeownership
today by comparing current and historical market trends. Specifically, we look at the credit
characteristics and product usage of first-time buyers, the demographics of first-time buyers,
and where first-time buyers are able to buy.
1
Report prepared by Kristin Wong and Logan Herman.
2
https://www.nar.realtor/research-and-statistics/research-reports/aspiring-home-buyers-profile;
https://stories.wf.com/survey-many-americans-willing-takes-homeowners/
MARKET SNAPSHOT: FIRST-TIME HOMEBUYERS 2

2. Data
Our analysis primarily relies on the National Mortgage Database (NMDB), a nationally
representative, 5 percent sample of all outstanding, closed-end, first-lien, 1–4 family residential
mortgages.
3
We look at consumers purchasing their first home between 2002 and 2018, a
timeframe that covers a wide range of market conditions. We solely analyze home purchasers
buying a primary residence. For loans with more than one borrower, our analysis uses the
borrower with the longest payment record.
4
In the NMDB, first-time homebuyers are defined as borrowers who appear to have no previous
mortgage in the preceding seven years. Other analyses define first-time buyers more broadly, a
common definition of a first-time buyer is any borrower who did not appear to have a mortgage
for the preceding three years. Our analysis also differs from those that analyze cash-sales along
with financed purchases, such as the Home Buyers and Sellers Report from the National
Association of Realtors (NAR).
5
Among first-time buyers the number of cash-sales appears to be
small. The 2017 NAR Report found that 96 percent of first-time buyers financed their purchase
with a mortgage.
6
3
https://www.fhfa.gov/PolicyProgramsResearch/Programs/Pages/National-Mortgage-Database.aspx
4
Some loans have a mix of first-time and repeat borrowers. By analyzing only one borrower, the estimated number of
first-time buyers in this snapshot will be slightly higher than measures that require both borrowers to be first-time
buyers and slightly lower than measures that require only one borrower to be a first-time buyer.
5
https://www.nar.realtor/research-and-statistics/research-reports/highlights-from-the-profile-of-home-buyers-
and-sellers
6
https://libertystreeteconomics.newyorkfed.org/2019/04/a-better-measure-of-first-time-homebuyers.html
MARKET SNAPSHOT: FIRST-TIME HOMEBUYERS 3

3. First-time homebuyer
analysis
Despite rising home prices, first-time buyers still account for
approximately half of the home purchase mortgage market.
At the end of 2018, the average home price in the US was 12% above its 2007 peak.
7
Combined
with historically low housing inventory, affordability has been a concern expressed by many in
the housing industry.
8
Despite these concerns, about half of all home purchase mortgages have gone to first-time
buyers each year since 2002. While 600,000 fewer mortgages went to first-time buyers in 2018
than in 2002, this is primarily a result of the overall decline in the purchase market during the
financial crisis of 2007 to 2009 and the steady recovery since 2011.
FIGURE 1: NUMBER OF HOME PURCHASE LOANS ORIGINATED FOR FIRST-TIME AND REPEAT BUYERS
The reason for this may be that while home prices have been increasing, household incomes also
have been increasing and interest rates have been low. Indeed, according to the National
7
Black Knight HPI data
8
Joint Center for Housing Studies of Harvard University, The State of the Nation’s Housing 2019
MARKET SNAPSHOT: FIRST-TIME HOMEBUYERS 4

Association of Realtor’s Housing Affordability index, housing was more affordable in 2018 than
in 2000 based on the median family income.
Along with rising incomes, looser CLTV and DTI standards
have also helped first-time buyers afford pricier homes.
Conventional wisdom is that consumers should have a 20 percent down payment when
purchasing a home.
9
For first-time buyers, however, this task can be difficult and unnecessary.
Since 2002, the median combined loan-to-value ratio (CLTV)
10
for first-time buyers has been
greater than 80 percent. During the run up to the financial crisis, the median increased by five
percentage points, and it has since remained at this higher level. In the same time period, the
median CLTV for repeat borrowers also increased and now also remains at over 80 percent.
FIGURE 2: MEDIAN CLTV OF FIRST-TIME BUYERS
Homebuyer debt loads have increased as well. The median debt-to-income ratio (DTI) of repeat
and first-time buyers peaked at 41% and 40% in 2007, respectively, and then began to decline.
More recently, DTI ratios have been rising for both groups. At the end of 2018, the median DTI
of first-time buyers was one percentage point higher than of repeat buyers.
11
9
https://www.fanniemae.com/resources/file/research/housingsurvey/pdf/consumer_understanding_research.pdf
10
The CLTV is the ratio of all secured loans on a property to the value of a property.
11
The pre-crisis DTI medians are likely underestimated. During the housing boom, some DTIs may have been based
upon incomes that were overstated as a result of stated income lending. Post-crisis, lenders are now required to
verify a borrower’s income.
MARKET SNAPSHOT: FIRST-TIME HOMEBUYERS 5

FIGURE 3: MEDIAN DTI OF FIRST-TIME BUYERS
However, looser CLTV and DTI standards have mainly helped
first-time borrowers with higher credit scores.
In the years prior to the financial crisis, the median credit score for both first-time buyers and
repeat buyers trended downward. Since 2007, however, that trend has been reversed as lenders
tightened their underwriting requirements. (In more recent years, an improving economy also
likely contributed to improved financial outcomes and overall higher scores.) In 2018, the
median credit score of first-time buyers was 32 points higher than in 2002. The spread between
the median credit score of first-time buyers and repeat buyers in 2018 was 45 points, slightly
higher than the spread in 2002.
FIGURE 4: MEDIAN VANTAGE SCORE OF FIRST-TIME BUYERS
MARKET SNAPSHOT: FIRST-TIME HOMEBUYERS 6
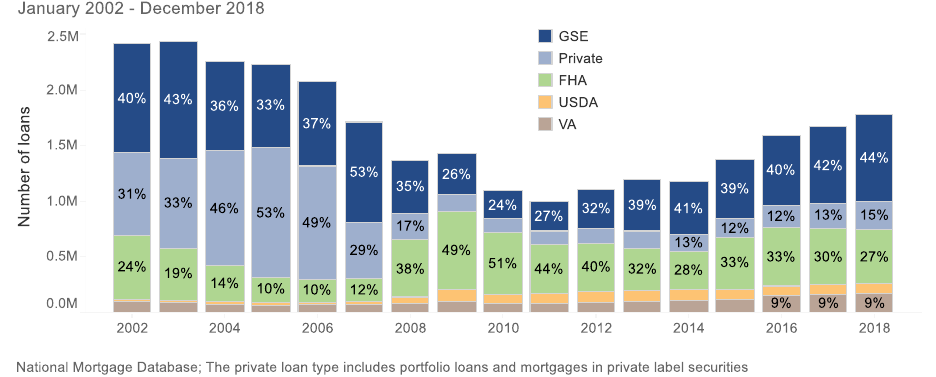
First-time buyers have migrated away from the private market and
are now most likely to turn to the GSEs.
Directly after the financial crisis, the private market shrank, and first-time buyers initially
migrated towards loans insured by the Federal Housing Administration (FHA loans). As the
market recovered, the FHA market share retreated and loans guaranteed by Fannie Mae or
Freddie Mac (Government Sponsored Enterprise loans or GSE loans) became the most common
choice for first-time buyers. Additionally, the GSEs introduced low down payment programs in
2014, which rendered the GSEs more competitive for borrowers with higher credit scores. This
trend is also seen among repeat borrowers. Even with these trends, among first-time
homebuyers the shares of both FHA loans and other government insured or guaranteed loans
are higher than they were in 2002, while the share of loans held by creditors on their own
balance sheets (“portfolio loans”) is half of what it was in 2002.
FIGURE 5: NUMBER AND SHARE OF LOANS ORIGINATED FOR FIRST-TIME BUYERS BY LOAN TYPE
Although first-time buyers are now most likely to have GSE loans, government programs still
play an important role in getting first-time buyers into homes. Originations of loans insured or
guaranteed by the Department of Agriculture (USDA loans) and loans guaranteed by the
Department of Veterans Affairs (VA loans) increased immediately after the financial crisis and
their volume remains higher than before—USDA loans went from 1% of first-time buyer
originations to 5% from 2002 to 2018, and the VA market share increased from 4% to 9%.
MARKET SNAPSHOT: FIRST-TIME HOMEBUYERS 7

Research from the CFPB found that the share of first-time homebuying servicemembers using
VA loans increased from 30% before 2007 to 78% in 2016.
12
The majority of loans originated under government programs still go to first-time buyers.
However, these programs have grown to attract more repeat buyers, particularly the VA
program. The VA program allows borrowers to purchase a home with no downpayment; as of
2019, nearly 90% of VA borrowers take advantage of this benefit.
13
FIGURE 6: PERCENT OF HOME PURCHASE ORIGINATIONS THAT WENT TO FIRST-TIME BUYERS BY
LOAN TYPE
Generally, first-time buyers obtain mortgages at the same
age they did before the financial crisis. Black borrowers
become first-time buyers noticeably later than before.
During the years prior to the financial crisis, the median age of first-time buyers decreased.
Over the past decade, the age of first-time home buyers when they buy their home has increased.
This has fueled concerns that younger buyers can no longer afford homeownership. However,
the ages of today’s first-time buyers are not so different than in the recent past. The median age
of first-time buyers in 2018 is the same as it was in 2002 and 2003, 32 years old.
12
https://files.consumerfinance.gov/f/documents/cfpb_consumer-credit-trends_first-time-homebuying-
servicemember-mortgages_022019.pdf
13
https://www.va.gov/housing-assistance/home-loans/
MARKET SNAPSHOT: FIRST-TIME HOMEBUYERS 8

FIGURE 7: MEDIAN AGE OF FIRST-TIME BUYERS
When broken down by race and ethnicity, it becomes clear that some groups have had larger
changes in the age of first-time homeownership than others. In 2018, the median first-time black
borrower was six years older than the median non-Hispanic white borrower. That is a much larger
disparity than in 2002, when the age gap between black and white first-time borrowers was just
two years. Black borrowers were particularly hard hit during the financial crisis, and accordingly,
were more likely to go from owning to renting.
14
The resulting lost wealth and generational impact
likely contributed to the increasing age gap in first-time homeownership.
15
14
https://files.stlouisfed.org/files/htdocs/publications/review/2017-02-15/the-homeownership-experience-of-
minorities-during-the-great-recession.pdf
15
https://www.urban.org/urban-wire/what-explains-homeownership-gap-between-black-and-white-young-adults
MARKET SNAPSHOT: FIRST-TIME HOMEBUYERS 9

FIGURE 8: MEDIAN AGE OF FIRST-TIME BUYERS BY RACE AND ETHNICITY
First-time buyers in expensive MSAs have generally been
older than in more affordable areas. Post-crisis, the age gap
is growing.
Affordability challenges also differ by geographical regions and characteristics. First-time
borrowers in more costly metropolitan statistical areas (MSAs) tend to be older than buyers in
more affordable MSAs. The median age of first-time buyers declined in most MSAs during the
housing boom prior to the financial crisis. Median age in higher-cost MSAs has since increased
to levels higher than in 2002, while in many lower-cost MSAs the median age has returned to
pre-housing boom levels.
MARKET SNAPSHOT: FIRST-TIME HOMEBUYERS 10

FIGURE 9: MEDIAN AGE OF FIRST-TIME BUYERS BY MSA COST
Despite the accelerated aging of rural areas, rural first-time
buyers borrow at similar ages to their urban counterparts.
Rural counties contain over 85 percent of “older age counties,”
16
many of which experience
persistent population loss of young adults.
17
However, rural areas remain a consistently strong
market for first-time homebuyers.
16
This analysis defines “rural” as non-metropolitan counties and “urban” as metropolitan counties according to the
USDA 2013 Rural-urban Continuum Codes. “Older age counties” are defined as counties with more than 20 percent
of their population age 65 or older.
17
https://www.usda.gov/media/blog/2018/12/20/rural-aging-occurs-different-places-very-different-reasons
MARKET SNAPSHOT: FIRST-TIME HOMEBUYERS 11

FIGURE 10: NUMBER OF HOME PURCHASE LOANS ORIGINATED FOR FIRST-TIME BORROWERS BY
GEOGRAPHY
Since 2002, borrowers in rural areas have made up 11% to 13% of all first-time homebuyers. In
2018 the median age of a rural first-time borrower was two years younger than the median age
of an urban first-time borrower. That is a reversal of the situation in 2002 when the median age
of a rural first-time buyer was one year older than the median age of an urban first-time
borrower.
FIGURE 11: MEDIAN AGE OF FIRST-TIME BUYERS BY GEOGRAPHY
Rural borrowers benefit from a more affordable housing supply and USDA’s specialized loan
programs, which increase opportunities to purchase homes at a younger age. USDA loans have
become an increasingly important source of credit for rural first-time borrowers, increasing
from 4% of rural first-time buyer loans in 2002 to 17% in 2018.
MARKET SNAPSHOT: FIRST-TIME HOMEBUYERS 12

FIGURE 12: NUMBER OF RURAL LOANS ORIGINATED FOR FIRST-TIME BUYERS BY LOAN TYPE
The median CLTV and DTI for rural first-time borrowers are
lower than for urban buyers although the gap has narrowed
since 2002.
Prior to the financial crisis, rural borrowers had lower CLTVs than urban borrowers. Since
2007, the CLTVs of first-time urban and rural borrowers have converged. This trend coincides
with a relative increase in rural USDA and FHA loans that tend to have higher CLTVs.
FIGURE 13: MEDIAN CLTV OF FIRST-TIME BUYERS BY GEOGRAPHY
Even though rural borrowers tend to have lower incomes in comparison to their urban
counterparts, the median rural borrower had lower DTIs over the past 15 years as rural
MARKET SNAPSHOT: FIRST-TIME HOMEBUYERS 13

borrowers have greater access to relatively lower cost housing. In 2018, the median rural first-
time borrower had an income of $54,000, compared to $68,000 for urban borrowers.
18
FIGURE 14: MEDIAN DTI OF FIRST-TIME BUYERS BY GEOGRAPHY
The median credit score of first-time rural borrowers has
risen but remains below the median for urban buyers.
Prior to the start of the housing boom, the median credit score of first-time rural and urban
buyers was the same. In the early 2000s, median credit scores of rural and urban borrowers
diverged and have continued to grow apart. As of 2018, the median credit score of an urban
first-time homebuyer was 24 points higher than the median credit score of a rural first-time
homebuyer.
18
National Mortgage Database
MARKET SNAPSHOT: FIRST-TIME HOMEBUYERS 14

FIGURE 15: MEDIAN VANTAGE SCORE OF FIRST-TIME BUYERS BY GEOGRAPHY
MARKET SNAPSHOT: FIRST-TIME HOMEBUYERS 15
4. Conclusion
First-time buyers after the financial crisis face disparate sets of challenges on the road to
attaining homeownership. New buyers enter a market that is limited in inventory and has
shifted to borrowers with higher credit scores. While the overall median age of first-time buyers
has not significantly changed since the early 2000s, racial disparities continue to grow in the
market. The age gap between black and non-Hispanic white borrowers has tripled since 2002.
Home affordability also varies significantly by region and housing market. Rural borrowers
have lower DTIs and lower credit scores than their urban counterparts. Borrowers in some
affordable MSAs buy their first home around the same age as they did prior to the financial
crisis. Borrowers in expensive MSAs are typically older and their median age at the time of
purchase has continued to increase since the financial crisis. As home prices remain relatively
affordable for median-income households nationwide, credit scores, buyer demographics, and
location play key roles in determining when first-time buyers enter the housing market.
MARKET SNAPSHOT: FIRST-TIME HOMEBUYERS 16
