
Arlyn UpScale - Data Logging with Google
Spreadsheets
By Arlyn Scales
DATA LOGGING WITH GOOGLE SPREADSHEETS
1.1 Introduction
Please note, this feature is only available if the Arlyn UpScale is equipped with USB Datalogging Option and any of the TCP/IP
options (WiFi or Ethernet). Even though the USB Datalogging Option calls for ‘USB’, no USB hardware is required for this feature to
work.
In addition to logging data locally (i.e. internal database and exported to USB stick), the Arlyn UpScale also features the ability to log
data directly online, into a Google Spreadsheet. The logging of data can be observed almost in real time (allowing for a 2 second
delay due to the time it takes for the data to be posted to the internet).
Any Google Spreadsheet can be used to implement this feature as long as edit permissions have been set appropriately. Use the
steps below to create and configure a Google Spreadsheet to accept data.
1.2 Benefits
Using a live Google Spreadsheet for Data Logging is especially useful for customers who want to view their scale data logging live
anywhere at any time. It’s a simple replacement of complex and rigid web logging method that is still being used by other scale
vendors.
Here are other benefits of live Google Spreadsheet logging.
1) View incoming scale data from anywhere in the world.
2) Share incoming live data with anyone who has the Google Spreadsheet link
3) Perform live analysis of incoming data such as daily weight increase and weight distribution.
4) Use full spectrum of Google Spreadsheet capabilities and add-ons on incoming data. No proprietary software needed.
5) No need to wait until the end of period before exporting data from scale.
A demonstration of live Google Spreadsheet logging can be seen here: https://youtu.be/xxURKe_TWuo
1.3 Limitations
1) Google Spreadsheet logging will only work if the scale is connected to the internet through WiFi or Ethernet.
2) If the internet is disconnected, the scale will continue to log into its own internal table. This can be later exported through
email or using a USB Flash Drive.
3) Google Spreadsheet logging is slower than local Scale logging due to the delay in opening a connection to the internet and
posting the data on the spreadsheet.
4) Google also has fallback rate limits. If the logging happens too frequently, then the Google Spreadsheet engine throttles
incoming data speeds. Experiments show that setting the log period at 10 seconds is appropriate. Any period faster than
that will not work.
5) Google Spreadsheet must be initiated through an account first. Once the spreadsheet has been initialized, it can then be set
to be accessed by anyone with the link to the spreadsheet.
1.4 Setup
Follow the steps below to setup a Google Spreadsheet and the Arlyn UpScale for live Data Logging.
V1.2

1.4.1 Part I: Create a Google Spreadsheet for UpScale Data Logging
1) Create a Google account (if you do not have one).
Google only allows creation of a Spreadsheet through a Google account. Once the account is created and the Spreadsheet is
generated, the Spreadsheet can be accessed and used by anyone as long as the privacy settings have been set correctly.
2) Create a new Spreadsheet.
a. Go to Google Drive.
b. In the “My Drive” menu, select “Google Sheets” and create a new spreadsheet.
3) To allow the Google Spreadsheet to capture data through the internet, a script program must be embedded into the sheet.
See the code below. The code is available under Software Downloads section on the Arlyn Scales website.
https://www.arlynscales.com/software-downloads/. Look for the “Google Spreadsheet Script for Datalogging” file and
download it. To add a script to the Google Spreadsheet, follow the steps below.
a. In the Spreadsheet menu, click on “Tools” -> “Script Editor”. This will open a new window/tab with a editable code
page.
b. Select all text in this page and delete it.
c. Go to https://www.arlynscales.com/software-downloads/.
d. Look for the “Google Spreadsheet Script for Datalogging” file and download it.

e. Open the downloaded text file.
f. Copy the text from the text file in (e) Step 3 above and paste it in the code page.
4) Publish the script as a Web App.
a. Once the code has been pasted in, go to the Script Window menu and press “Publish” -> “Deploy as web app..”
b. A dialog box will pop up prompting to name the script project. Enter the name of the project, something like
“V9Script” or “GsScript”. Press OK.
c. After pressing OK above, the “Deploy as web app” dialog pops up.
d. In the “Deploy as web app” dialog, fill in the following:
i. Project Version: New (leave the description field blank)
ii. Execute the app as: Me (or the current logged in account)

iii. Who has access to the app: Anyone, even anonymous
e. Once done, hit the “Deploy” button.
f. Depending on the security settings of your browser, you might get certain warnings. You will get a warning that the
app is not verified.
g. Click on the “Advanced” link and then click on the name of the script link. In our case, its “GsScript (unsafe)”.
h. The next screen will prompt you to sign in once again into your Google Account. Once done, a permissions prompt
will show asking you to allow and trust the script you just wrote.

i. Click on the “Allow” button to proceed.
j. Finally, the Deployment is complete. The confirmation screen will appear.
k. Copy the letters appearing between the ‘/s/’ and the ‘/exec’ path segments. This will be used later for configuring
the scale. e.g. If the URL looks like this:
https://script.google.com/macros/s/AKfycbyGRJaxI5tPGRIw34gYuUO_YOOW7-NfUcg8yb0wt5JIaFKkTxnl/exec
Then only extract this: AKfycbyGRJaxI5tPGRIw34gYuUO_YOOW7-NfUcg8yb0wt5JIaFKkTxnl
l. The above sequence of letters is your Google Spreadsheets Web App ID. To make things easier in the next steps,
create a file on your PC called “link.txt” and save this Web ID. Put the file in a USB stick (recommended to use the
one that came with your scale), to later import it in the scale.
m. You can find this URL anytime by going to the “Publish” menu item and clicking “Deploy as web app…”.
n. Close the script page and go back to the Google Spreadsheet.
5) Name and Share the Google Spreadsheet
a. Once the Google Spreadsheet has been configured with script code, we need to name it and share it so that the
scale can find it and upload data to it.
b. Click the blue “SHARE” Button on the top right corner of the Spreadsheet.
c. The resulting dialog will ask for Sheet name. Just name it anything you want and press OK.

d. The next dialog pop-up shows the “Share with others” parameters. Click on “Get Shareable link” button at the top
right of the corner and make sure it turns green. A link appears on dialog. Set the link with “Anyone with the link
can edit”. You can also leave it as “…can view”. However, no one will be able to edit the Spreadsheet except you,
the owner.
e. Press “Done” to close the dialog.
6) Refresh the Spreadsheet and give it about 5 to 10 seconds until a new menu item appears call “V9 Script”.
7) Click on “V9 Script” -> “Active Log” to activate the data logging script for this sheet.
8) You can add more sheets to the workbook. The scale will only log data on the sheet on which the V9 Script logging has been
activated.
1.4.2 Part II: Setup the Arlyn UpScale indicator for Google Spreadsheet Data Logging
Now that you have a Google Spreadsheet loaded with a data logging script, it’s time to setup the Arlyn UpScale indicator to log data
onto the spreadsheet.
The scale must be equipped with USB Datalogging Option and either of the TCP/IP options (Ethernet or WiFi). The Google
Spreadsheet feature is a subset feature of the USB Data Logging features. The Data logger feature must be set correctly for the
Google Spreadsheet feature to work. For further information on setting up USB Data Logging, refer to the USB Data Logging Section.
Follow the steps below to setup Google Spreadsheet datalogging.
Prerequisite: You must have Google Spreadsheets Web App ID as extracted from 6(k) in Section 27.1 1 either saved in a USB stick
“link.txt” file or written out.
1.4.2.1 Confirm Data Logger Settings
1) In the Arlyn UpScale indicator look for the 3-dot Quick Action menu on the top right corner of the screen and press it. Press
the “Settings” option.

2) On the resulting Settings Screen, press the “USB Datalogger” option on the left panel to reveal the Datalogging setup
screen.
3) Press on “Data Logger Settings” to open the Data Logger Settings dialog.
4) Confirm or set the following selections in their respective fields.
Active – Yes
Type – Set the Data Logger mode type to be either Triggered or Periodic. If you set it to Periodic, then the Time Interval
field is enabled. You can enter the interval in seconds to set the frequency of logging weights to the internal table.
Time Interval – 10 seconds or more to bypass Google Spreadsheet’s rate limits.
5) Press the SAVE button to save your settings.
1.4.2.2 Enable Google Spreadsheets
6) On the same Data Logger Setup Screen, enable Google Spreadsheets by toggling the switch on the option to “ON”.
7) Long Press the Google Spreadsheets option to open up the Google Spreadsheets Web App ID dialog

8) There are two ways to assign the Google Spreadsheet Web App ID into the scale.
a. Type in the Web App ID obtained from item (6) (k) in section 28.3.1 into this dialog. This will be hard to do and
prone to errors so we do not recommend this method.
b. Or, plug in the USB stick where you saved the “link.txt” file with the Google Spreadsheet Web App ID.
i. Once plugged in, wait for few seconds for the Arlyn UpScale indicator to recognize the USB stick. Then
press the “Import link from USB ‘link.txt’” button to import the link.
ii. The new link will appear on the field of the dialog.
9) Press OK to save the Web App ID.
1.4.3 Part III: Start Logging
Once both the computer and Google Spreadsheets have been setup, we can start the logging process. Make sure the that you have
enabled “Active Log” on the Google Spreadsheet (see item (7) in Section 27.1).
On the scale on the main weight screen, look for the LOG WEIGHT button (for Triggered setting) or the START LOGGING button (for
Periodic setting). Press on it. You will see the data coming into the Spreadsheet live.
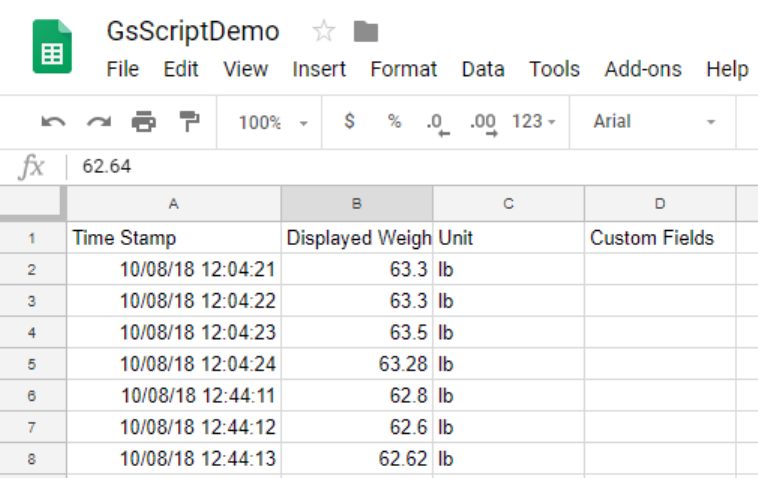
If the order of the columns is not suitable to you, you can easily move the columns around to match your desired order. The
Spreadsheet will internally redirect the data to the right column.
You do not have to have the Spreadsheet open for this feature to work. As long as the scale is connected to the internet, it will log
data to the referenced Spreadsheet. You can log in anywhere at anytime to view the Spreadsheet.
1.5 Technical Support and Disclaimers
The “Data Logging with Google Spreadsheets” feature is available “as is”. We make no warranties as to how it is used and the effects
of using this feature.
The feature is available as part of the Data Logging function in the Arlyn UpScale at no additional charge.
Technical support for this and other “Extra Features” will be provided at a nominal charge of $100 an hour.
