
MILLIMAN RESEARCH REPORT
Medicare Advantage
organizations: Financial
results for 2022
November 2023
Phil Ellenberg
Shyam Kolli, FSA, MAAA
Tushar Makhija, ASA, MAAA
Greg Sgrosso, FSA, MAAA
MILLIMAN REPORT
Table of Contents
INTRODUCTION ............................................................................................................................................................ 3
SUMMARY OF CY 2022 FINANCIAL RESULTS .......................................................................................................... 4
ADMINISTRATIVE COST ANALYSIS ........................................................................................................................... 8
CONCLUSION ............................................................................................................................................................. 11
LIMITATIONS AND DATA RELIANCE ....................................................................................................................... 11
QUALIFICATIONS ....................................................................................................................................................... 11
APPENDIX 1: FINANCIAL METRICS AND MAO CHARACTERISTICS .................................................................... 12
APPENDIX 2: DEFINITION OF FINANCIAL METRICS .............................................................................................. 16
ABOUT THE AUTHORS ............................................................................................................................................. 19
ACKNOWLEDGMENTS .............................................................................................................................................. 19

MILLIMAN REPORT
Medicare Advantage organizations: 3 November 2023
Financial results for 2022
Introduction
This report summarizes financial information and analysis related to administrative costs reported by the Medicare
Advantage organizations (MAOs) for calendar year (CY) 2022. This is the fourth annual update of this report. The prior
editions addressed CY 2019 through CY 2021 experience and can be obtained from the Milliman website.
The
methodology used to generate this year’s report is substantially consistent with the prior year's report.
Enrollment in Medicare Advantage (MA) continues to grow, with 51%
1
of Medicare-eligible beneficiaries opting for this
government-sponsored program where private health plans provide benefits to Medicare beneficiaries as an
alternative to traditional fee-for-service (FFS) Medicare. This is the first time that there are more Medicare-eligible
enrollees in MA as compared to FFS. The primary source of this growth is beneficiaries switching from FFS to MA
and from new enrollees who are aging into the program selecting MA. MAOs work with the Centers for Medicare and
Medicaid Services (CMS) to provide healthcare benefits under Medicare. They handle administrative costs and profit
in exchange for set capitation revenue. The federal government largely funds the cost of the program, with the
revenue received by private plans based on laws, regulations, and an underlying bidding process established,
regulated, and overseen by CMS.
2
Traditional FFS Medicare allows members to visit any doctor anywhere in the United States that accepts Medicare. In
contrast, MAOs typically offer network-based plan designs in their defined service areas with differing additional
benefits, levels of member cost sharing, prescription drug coverage, and member premiums.
Most MA benefit plans offer coverage for additional benefits not covered by traditional FFS Medicare. Dental, vision, and
hearing are some of the most prevalent supplemental benefits, with more than 90% of the beneficiaries enrolling in plans
offering these benefits. Some of the other common supplemental benefits offered by MAOs include over-the-counter
(OTC) health-related items, fitness, nonemergency transportation, meals, acupuncture, and podiatry services. Plans
can also customize their benefit packages to offer certain benefits to a subset of chronically ill enrollees. Combined
benefit structures and reduction in cost sharing (RICS) plans have also gained in popularity in recent years. Combined
benefit structures give plans flexibility to combine multiple benefits under a single maximum plan benefit limit, a single
visit limit, or varying allowances by benefit within the package. The RICS benefit is specifically a dollar allowance that
beneficiaries can use to cover their cost sharing for benefits included in the RICS package.
3
In addition to offering additional benefits, MAOs can offer Medicare-covered services at cost-sharing levels less than
traditional FFS Medicare. Traditional FFS Medicare includes a Part A inpatient hospital deductible and daily
coinsurance (for days above 60) while MAOs may require the member to pay a copay upon hospital admittance or for
the first few days of the stay. Traditional FFS Medicare also includes a Part B deductible and 20% coinsurance that
applies to hospital outpatient and physician services while an MAO may require fixed copays that can vary by type
and place of service.
MA also includes prescription drug coverage through Medicare Advantage Part D (MAPD) plans. Most MAO benefit
plans include Part D as part of the benefit plan. Part D is funded by member premiums and by the federal government
through subsidies by CMS. There are certain programs within Part D where the MAO is not at risk, such as low-income
cost sharing (LICS), the Coverage Gap Discount Program (CGDP), and federal reinsurance. MAOs receive prospective
payments for these programs that are trued up at the end of the year. MAOs can differentiate their Part D coverage
through their formulary and member cost sharing, generally below the initial coverage limit (ICL). The Inflation
Reduction Act (IRA) will bring the most significant changes to the Part D program in 2025 since its inception.
1
Freed, M. et al. (August 9, 2023). Medicare Advantage in 2023: Enrollment Update and Key Trends. Kaiser Family Foundation. Retrieved
November 15, 2023, from https://www.kff.org/medicare/issue-brief/medicare-advantage-in-2023-enrollment-update-and-key-trends/.
2
Friedman, J.M., Swanson, B.L., Yeh, M., & Cates, J. (February 2020). State of the 2020 Medicare Advantage Industry: As Strong as Ever.
Milliman Research Report. Retrieved November 15, 2023, from https://www.milliman.com/-
/media/milliman/pdfs/articles/state_of_the_2020_medicare_advantage_industry.ashx.
3
Laktas, J., Yeh, M., & Friedman, J.M. (March 2023). Prevalence of supplemental benefits in the general enrollment Medicare Advantage
marketplace: 2019 to 2023. Retrieved November 15, 2023, from https://www.milliman.com/en/insight/prevalence-supplemental-benefits-general-
enrollment-ma-marketplace-2023.

MILLIMAN REPORT
Medicare Advantage organizations: 4 November 2023
Financial results for 2022
MAOs are licensed health insurance entities and are required to file a statutory annual statement with their state
insurance regulators. The statutory annual statement is a standard reporting structure developed and maintained by
the National Association of Insurance Commissioners (NAIC), with prescribed definitions allowing comparisons
among various reporting entities.
This report summarizes the CY 2022 experience for selected financial metrics of organizations reporting Medicare
Advantage experience under the Title XVIII Medicare line of business on the NAIC annual statement. We compiled
this information from the reported annual statements.
4
Individual reporting entities may be excluded from this report
for the following reasons:
Did not submit a health annual statement
Reported less than $10 million in annual Medicare (Title XVIII) revenue
Otherwise omitted from the NAIC database of health annual statements utilized for this report
The primary purpose of this report is to provide reference and benchmarking information for certain key financial
metrics used in the day-to-day analysis of MAO financial performance. This report summarizes the financial results
on a composite basis for all reporting MAOs.
Appendix 1 provides additional detail and stratifications of the financial metrics presented in this report.
Appendix 2 provides the methodology and assumptions used in developing the metrics presented in this report.
Summary of CY 2022 financial results
The CY 2022 financial information analyzed for this report comprises information for 426 reporting entities across 47
states, compared to 409 entities across 44 states from the prior year’s report. Information from Alaska, Montana, and
Wyoming is not represented, primarily because the reporting entities in these states were excluded based on the
filtering criteria described in the following paragraph. Of these 426 reporting entities, we identified 81 entities as
provider-sponsored health plans (PSHPs), based on publicly available parent organization information and their
status as provider entities. In this shortlist of 81 entities, we excluded large national PSHPs (like Kaiser) as these
plans are not representative of the subset we are targeting for comparison purposes. We analyzed the financial
performance of PSHPs separately from the traditional MAOs to identify any significant differences between the two
entity types. These findings are outlined in later sections of this report. We retrieved the annual statements from an
online database. In addition to the limiting criteria used to select companies in this report, certain MAOs may be
omitted from this report because of their exclusions from the online database.
The MAO financials included in this report comprise information from MA-only and MAPD plans and does not include
stand-alone prescription drug plans (PDPs). We compiled the financial data for the MAOs to produce outcomes of
key financial metrics for various company groupings. We summarized the distribution of results to allow for user
reference and benchmarking purposes. Unless otherwise stated, only companies with at least $10 million in MA
revenue were used in this analysis.
The primary financial metrics we analyzed for this report include the medical loss ratio (MLR), administrative loss ratio
(ALR), underwriting (UW) ratio, and risk-based capital (RBC) ratio. The selected metrics focus primarily on the
income statement values of the financial statement, except for the RBC ratio, which is a capital (or solvency)
measure. Appendix 2 of this report documents the methodology and formulas behind these metrics.
4
National Association of Insurance Commissioners. Annual Statement Database, as delivered by S&P Global, Inc, all rights reserved.
MILLIMAN REPORT
Medicare Advantage organizations: 5 November 2023
Financial results for 2022
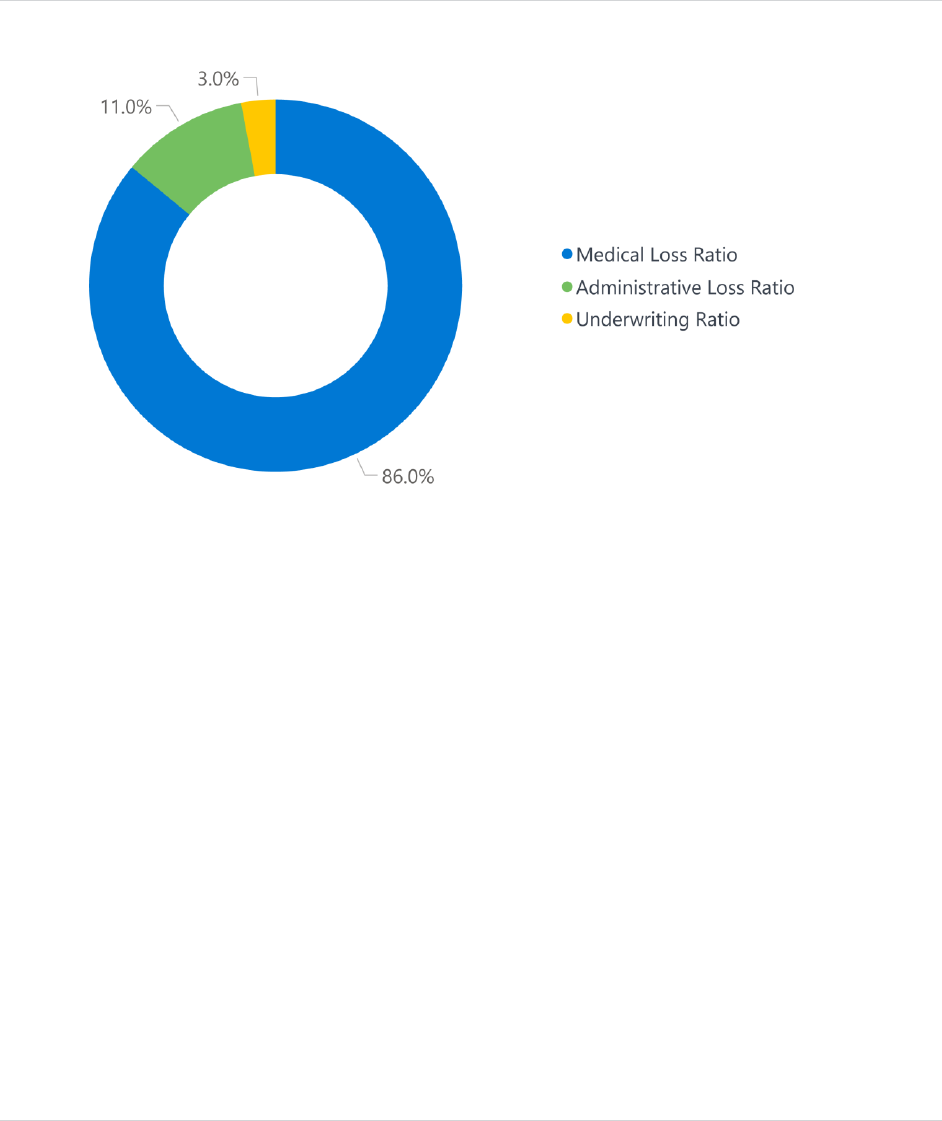
Figure 1 summarizes the composite CY 2022 financial results for the 426 companies meeting the criteria selected for
this study. The total MA revenue base represents over $335 billion with achieved underwriting gains of 3.0% (up from
1.8% last year). CY 2021 showed reduced margins due to higher utilization from some of the pent-up demand during the
the COVID-19 pandemic. The increase in underwriting gains in 2022 is aligned with the margins we have seen in the
MAO industry during pre-pandemic years. The positive UW ratio of 3.0% represents a composite across identified
MAOs (including PSHPs), with considerable variances by individual MAOs. In comparison, for CY 2022, the 81
PSHPs meeting the criteria selected for this study showed underwriting losses of 1.4% in aggregate.
FIGURE 1: COMPOSITE CY 2022 FINANCIAL RESULTS
Note: Values have been rounded.
Figure 2 shows the distribution of MAOs (including PSHPs) within ranges of UW ratios specific to CY 2022, indicating
that about the same number of MAOs reported gains (218 MAOs) compared to the number of MAOs reporting
underwriting losses (208 MAOs). Over half of the MAOs reported an underwriting margin within a range of plus or
minus 5%. In general, plans with larger membership have been more profitable compared to the smaller plans, as
can be seen later in this report in Figure 9 of Appendix 1. The underwriting ratio distribution for plans with greater
than $1 billion in revenue is significantly different from the nationwide average, with more than 75% of those plans
reporting gains. Figure 3 shows that PSHPs had a significantly different distribution, with only 38% of all PSHPs
reporting gains. About 17% of the PSHPs are reporting losses of more than 20%.

MILLIMAN REPORT
Medicare Advantage organizations: 6 November 2023
Financial results for 2022
FIGURE 2: CY 2022 UNDERWRITING RATIO DISTRIBUTION
FIGURE 3: CY 2022 UNDERWRITING RATIO DISTRIBUTION (PROVIDER-SPONSORED HEALTH PLANS ONLY)

MILLIMAN REPORT
Medicare Advantage organizations: 7 November 2023
Financial results for 2022
Over the past five years, aggregate MA revenue (in dollars) has grown by 80%. The main drivers of the revenue
growth include the year-to-year increase in CMS benchmark revenue, the increase in average star ratings from 4.07
in 2018 to 4.37 in 2022,
5
and enrollment growth in the MA market from the increase in Medicare eligibles as well as
the increase in the MA penetration rate. Enrollment included in this report increased by 47% over the same five-year
period, with the largest year-over-year increase of over 14% growth this past year. Figure 4 summarizes the
composite financial results for the most recent five-year period. The companies in each year’s sample are not the
same; however, the criteria used to select the companies are consistent from year to year.
FIGURE 4: FIVE-YEAR HISTORICAL FINANCIAL RESULTS
We note the following observations on the MA market over the most recent five years:
The composite UW ratio for CY 2022 is now closer to the average margins observed before the pandemic within
the MA markets.
The aggregate administrative loss ratio (ALR) fluctuated between 11.0% and 12.7% from CY 2018 through CY
2022. There was a moratorium on the Health Insurance Provider Fee (HIPF) in 2019 and HIPF was permanently
suspended starting CY 2021, which potentially explains to some degree the lower ALRs in those years.
6
Risk-based capital ratios in CY 2021 decreased for the first time since CY 2018 and decreased further in CY 2022.
The MLR in CY 2022 decreased by 1% after significantly increasing in CY 2021 relative to CY 2020, where the
pandemic had an impact.
5
Average member weighted star ratings by year for 2018 and 2022 were calculated from these sources:
https://www.cms.gov/files/document/2021starratingsfactsheet-10-13-2020.pdf and https://www.cms.gov/newsroom/fact-sheets/2024-medicare-
advantage-and-part-d-star-ratings.
6
The full text of the Consolidated Appropriations Act, 2016, is available at https://www.congress.gov/bill/114th-congress/house-bill/2029/text.

MILLIMAN REPORT
Medicare Advantage organizations: 8 November 2023
Financial results for 2022
Please note that the MLR calculated throughout this report is the MLR formula as defined in Appendix 2 below and
not the CMS MLR formula used for MLR rebates. This is consistent with how MLR is reported on the statutory annual
statement and does not make the adjustments that CMS allows for credibility, quality improvement activities, and
taxes and fees.
While Figure 4 illustrates the overall changes in the underwriting results over the last five years, it is also important to
understand how the underwriting results have varied across MAOs. Figure 5 illustrates the distribution of underwriting
results in the MA market for each calendar year from the MAOs included in our analysis.
FIGURE 5: DISTRIBUTION OF UNDERWRITING RESULTS BY YEAR
The composite UW ratio increased in CY 2022 after the five-year historical low of 1.8% in CY 2021. The percentage
of plans with a positive margin has remained stable from 2021 to 2022, at around 50%. During 2020 and prior years
before the pandemic, about 60% of the plans on average saw positive margins. The composite UW ratio reported by
the MAOs in CY 2022 represents an aggregate underwriting gain of approximately $10 billion in relation to the $335
billion of revenue.
Administrative cost analysis
MEDICARE ADVANTAGE-FOCUSED MAOS
The previous section of this report contains analyses of key financial metrics for 426 MAOs that reported operations
in the Medicare Title XVIII line of business, based on page 7 of the NAIC annual statement (Analysis of Operations by
Line of Business). This section examines the administrative expenses reported by the MAOs on the Underwriting and
Investment Exhibit Part 3 Analysis of Expenses page. This information is only reported at an aggregate MAO level
and detailed administrative expense information is not stratified by line of business (e.g., Medicare). Therefore, the
results presented in this section of the report are limited to the 260 MAOs that are defined as MA-focused in the
database used for this summary. The ALRs reported by the MA-focused MAOs were relatively consistent with the
remaining 166 MAOs, which were defined as non-MA-focused. The 260 MA-focused MAOs account for over 70% of
the MA revenue summarized for the purposes of this report, with an average 11.0% ALR. The remainder of this
section summarizes the reported administrative costs for only the MA-focused MAOs.

MILLIMAN REPORT
Medicare Advantage organizations: 9 November 2023
Financial results for 2022
SUMMARY OF RESULTS
The primary expense categories used in the Analysis of Operations by Line of Business page include the claim
adjustment expenses (CAE) and general administrative expenses (GAE). The CAE and GAE categories are further
stratified by additional subcategories of expenses in the Underwriting and Investment Exhibit Part 3 Analysis of
Expenses page, which is the basis of the administrative expense categories illustrated in this administrative cost
analysis. Figure 6 summarizes the CY 2022 administrative expenses by quartile of ALR performance for the 260
companies with an MA focus. The administrative expenses are stratified by administrative cost categories
summarized from the Underwriting and Investment Exhibit Part 3 Analysis of Expenses page.
FIGURE 6: ADMINISTRATIVE LOSS RATIO BY QUARTILE OF ALR PERFORMANCE
Note: Values have been rounded.
In composite, MAOs grouped in the fourth quartile have higher administrative loss ratios across all expense types
compared to MAOs grouped in the first, second, and third quartiles.
7
Between the third and fourth quartiles, human
capital (costs related to salaries, wages, and other items specific to in-house staffing resources) and operating
expenses account for most of the increase in administrative costs.
Figure 7 summarizes the administrative cost per member per month (PMPM) for the most recent five-year period for
all companies matching the inclusion criteria indicated in this report.
7
A quartile is a cut point dividing the number of data points in a data set into four parts, or quarters, of roughly equal size.

MILLIMAN REPORT
Medicare Advantage organizations: 10 November 2023
Financial results for 2022
FIGURE 7: ADMINISTRATIVE COST PMPM BY YEAR
Note: Values have been rounded.
Figure 7
8
illustrates an overall increase in the reported administrative cost on a PMPM basis from CY 2018 to CY
2022. We observed a significant decrease in the administrative cost PMPM from CY 2018 to CY 2019 and from CY
2020 to CY 2021, likely due to the inclusion of the HIPF in 2018 and 2020. The average annualized increase in the
median is approximately 7.0% from CY 2018 to CY 2022. The percentiles illustrated are less sensitive to outliers and
changes in reported administrative expense for the largest health plans.
The PMPM increase from CY 2018 to CY 2022 is mostly attributable to general inflationary trends as well as changes
in the membership covered by the MAOs in this study, such as the increase in the number of beneficiaries in special
needs plans (SNPs), which have higher claim and administrative costs. The range of administrative cost PMPMs over
the years is likely attributable to a combination of drivers such as more start-ups entering the market with higher fixed
administrative costs in the initial years; increased prevalence of SNPs, which require more intensive member care
coordination; and/or other enrollment changes that can affect the PMPMs. As expected, the lowest ALR year in this
period was in CY 2019 (when there was a moratorium on the HIPF).
8
The methodology used to calculate numbers in Figure 7 was updated as compared to previous years’ reports. This new methodology now considers
2022 enrollment for each MAO and uses enrollment as weights to calculate percentiles.

MILLIMAN REPORT
Medicare Advantage organizations: 11 November 2023
Financial results for 2022
Conclusion
Over 50% of people aged 65 and older in the United States enroll in MA.
9
With Baby Boomers (born between 1946
and 1964) aging into Medicare, combined with new additional benefits, benefit flexibility allowed by CMS, and lower
premiums each year,
10
the MA market continues to grow and play an even bigger role in the Medicare market. The
Congressional Budget Office (CBO) predicts MA penetration will increase to 62% of the Medicare market over the
next decade.
11
The analysis shows that about half of the total MAOs (including PSHPs) were profitable in 2022.
MAOs offer popular coverage options for Medicare beneficiaries, and their financial results will help us understand
the viability and the continued sustainability of private health insurers in the MA market.
The results in this report provide reference and benchmarking information for certain key financial metrics used in the
day-to-day analysis of MAO financial performance.
Limitations and data reliance
We compiled the results contained in this report using data and information obtained from the statutory annual
statements for MAOs filed with the respective state insurance regulators. We retrieved the annual statements from
an online database on August 17, 2023. In addition to the limiting criteria used to select companies in this report,
certain MAOs may be omitted from this report because of the timing of annual statement submissions or their
exclusions from the online database.
Milliman developed certain models to estimate the values included in this correspondence. The intent of the models
was to estimate the MAO financial results presented in this report. We reviewed the models, including their inputs,
calculations, and outputs, for consistency, reasonableness, and appropriateness to the intended purpose and in
compliance with generally accepted actuarial practice and relevant actuarial standards of practice (ASOP). The
models rely on data and information as input to the models. We relied upon certain data and information for this
purpose and accepted it without audit. To the extent the data and information provided is not accurate, or is not
complete, the values provided in this correspondence may likewise be inaccurate or incomplete. Milliman’s data and
information reliance includes the NAIC annual statement database. The models, including all input, calculations, and
output, may not be appropriate for any other purpose.
This report is intended for informational purposes only. Milliman makes no representations or warranties regarding
the contents of this report. Likewise, readers of this report are instructed that they are to place no reliance upon this
report that would result in the creation of any duty or liability under any theory of law by Milliman or its employees to
third parties.
The views expressed in this research paper are made by the authors and do not represent the opinions of Milliman,
Inc. Other Milliman consultants may hold alternative views and reach different conclusions from those shown.
Qualifications
Guidelines issued by the American Academy of Actuaries require actuaries to include their professional qualifications
in all actuarial communications. Shyam Kolli, Greg Sgrosso, and Tushar Makhija are members of the American
Academy of Actuaries and meet the qualification standards for performing the analyses in this report.
9
Freed, M. et al., Kaiser Family Foundation, op cit.
10
CMS (September 30, 2021). CMS Releases 2022 Premiums and Cost-Sharing Information for Medicare Advantage and Prescription Drug Plans.
Press release. Retrieved November 15, 2023, from https://www.cms.gov/newsroom/press-releases/cms-releases-2022-premiums-and-cost-sharing-
information-medicare-advantage-and-prescription-drug.
11
Freed, M. et al., Kaiser Family Foundation, op cit.

MILLIMAN REPORT
Medicare Advantage organizations: 12 November 2023
Financial results for 2022
Appendix 1: Financial metrics and MAO characteristics
In addition to the figures illustrated in the body of this report, we analyzed the financial metrics stratified by certain
MAO characteristics to understand the potential impact these characteristics have on the reported financial results.
The figures in Appendix 1 illustrate the following financial metrics and MAO characteristics:
FINANCIAL METRICS
Medical loss ratio
Underwriting ratio
Risk-based capital ratio
Administrative loss ratio
MAO CHARACTERISTICS
Annual Medicare revenue
Annual Medicare revenue PMPM
MAO type (Medicare-focused versus all other MAOs)
Underwriting gain/loss
FIGURE 8: MEDICAL LOSS RATIO: CY 2022 RESULTS
GROUPING
CATEGORY
N
REVENUE
(IN $ BILLIONS)
PERCENTILE
MEAN
10TH
25TH
50TH
75TH
90TH
COMPOSITE
COMPOSITE
426
335.4
86%
78%
83%
87%
92%
100%
ANNUAL
$0 MILLION TO
$100 MILLION
176
6.8
89%
73%
80%
87%
95%
108%
REVENUE
$100 MILLION TO
$500 MILLION
131
32.6
88%
79%
84%
87%
91%
99%
$500 MILLION TO
$1 BILLION
51
36.4
87%
82%
84%
87%
89%
93%
MORE THAN
$1 BILLION
68
259.7
85%
81%
84%
85%
88%
93%
REVENUE
LESS THAN $1000
131
36.8
89%
79%
85%
89%
96%
107%
PMPM
$1000 to $1150
99
92.1
87%
80%
84%
87%
93%
99%
$1150 to $1300
68
128.5
84%
81%
83%
86%
89%
95%
MORE THAN $1300
128
77.9
86%
76%
80%
84%
89%
95%
BUSINESS
MEDICARE FOCUSED
260
250.2
85%
78%
82%
86%
92%
101%
FOCUS
ALL OTHERS
166
85.2
89%
79%
84%
87%
93%
99%
GAIN/(LOSS)
REPORTED A GAIN
218
274.4
84%
75%
80%
84%
86%
87%
POSITION
REPORTED A LOSS
208
61.0
93%
85%
89%
92%
99%
109%
PSHPs
PSHPs
81
26.6
89%
82%
85%
90%
96%
105%
ALL OTHER MAOs
345
308.9
86%
77%
82%
86%
91%
99%

MILLIMAN REPORT
Medicare Advantage organizations: 13 November 2023
Financial results for 2022
FIGURE 9: UNDERWRITING RATIO: CY 2022 RESULTS
GROUPING
CATEGORY
N
REVENUE
(IN $ BILLIONS)
PERCENTILE
MEAN
10TH
25TH
50TH
75TH
90TH
COMPOSITE
COMPOSITE
426
335.45
3%
-20%
-6%
0%
4%
8%
ANNUAL
$0 MILLION TO
$100 MILLION
176
6.77
-8%
-37%
-15%
-3%
4%
7%
REVENUE
$100 MILLION TO
$500 MILLION
131
32.59
-1%
-14%
-4%
0%
5%
8%
$500 MILLION TO
$1 BILLION
51
36.39
2%
-3%
-1%
2%
4%
7%
MORE THAN
$1 BILLION
68
259.69
4%
-3%
0%
3%
5%
8%
REVENUE
LESS THAN $1000
131
36.85
-2%
-36%
-15%
-2%
2%
5%
PMPM
$1000 to $1150
99
92.11
1%
-15%
-7%
1%
4%
7%
$1150 to $1300
68
128.54
5%
-7%
-2%
2%
6%
8%
MORE THAN $1300
128
77.94
4%
-11%
-3%
3%
6%
10%
BUSINESS
MEDICARE FOCUSED
260
250.2
4%
-23%
-7%
0%
4%
7%
FOCUS
ALL OTHERS
166
85.2
0%
-14%
-6%
0%
5%
8%
GAIN/(LOSS)
REPORTED A GAIN
218
274.4
5%
1%
2%
4%
7%
10%
POSITION
REPORTED A LOSS
208
61.0
-6%
-36%
-15%
-7%
-2%
-1%
PSHPs
PSHPs
81
26.6
-1%
-31%
-12%
-2%
2%
5%
ALL OTHER MAOs
345
308.9
3%
-16%
-5%
1%
5%
8%

MILLIMAN REPORT
Medicare Advantage organizations: 14 November 2023
Financial results for 2022
FIGURE 10: RISK-BASED CAPITAL RATIO: CY 2022 RESULTS
GROUPING
CATEGORY
N
REVENUE
(IN $ BILLIONS)
PERCENTILE
MEAN
10TH
25TH
50TH
75TH
90TH
COMPOSITE
COMPOSITE
426
335.45
580%
302%
348%
437%
620%
954%
ANNUAL
$0 MILLION TO $100
MILLION
176
6.77
552%
302%
342%
429%
654%
1281%
REVENUE
$100 MILLION TO
$500 MILLION
131
32.59
596%
314%
356%
476%
600%
767%
$500 MILLION TO
$1 BILLION
51
36.39
597%
306%
359%
454%
734%
957%
MORE THAN
$1 BILLION
68
259.69
573%
263%
361%
431%
563%
693%
REVENUE
LESS THAN $1000
131
36.85
761%
317%
348%
468%
756%
1275%
PMPM
$1000 to $1150
99
92.11
521%
291%
341%
488%
639%
1152%
$1150 to $1300
68
128.54
398%
238%
356%
446%
613%
850%
MORE THAN $1300
128
77.94
617%
303%
345%
414%
512%
690%
BUSINESS
MEDICARE FOCUSED
260
250.2
408%
284%
335%
412%
555%
772%
FOCUS
ALL OTHERS
166
85.2
660%
313%
381%
504%
719%
1216%
GAIN/(LOSS)
REPORTED A GAIN
218
274.4
470%
312%
370%
486%
623%
942%
POSITION
REPORTED A LOSS
208
61.0
712%
258%
334%
412%
603%
1055%
PSHPs
PSHPs
81
26.6
476%
303%
329%
403%
545%
642%
ALL OTHER MAOs
345
308.9
593%
297%
350%
443%
644%
986%

MILLIMAN REPORT
Medicare Advantage organizations: 15 November 2023
Financial results for 2022
FIGURE 11: ADMINISTRATIVE LOSS RATIO: CY 2022 RESULTS
GROUPING
CATEGORY
N
REVENUE
(IN $ BILLIONS)
PERCENTILE
MEAN
10TH
25TH
50TH
75TH
90TH
COMPOSITE
COMPOSITE
426
335.45
11%
9%
11%
13%
16%
24%
ANNUAL
$0 MILLION TO
$100 MILLION
176
6.77
18%
11%
12%
16%
24%
34%
REVENUE
$100 MILLION TO
$500 MILLION
131
32.59
13%
9%
11%
12%
15%
17%
$500 MILLION TO
$1 BILLION
51
36.39
11%
8%
9%
11%
13%
14%
MORE THAN
$1 BILLION
68
259.69
11%
7%
10%
11%
12%
14%
REVENUE
LESS THAN $1000
131
36.85
13%
10%
12%
14%
20%
29%
PMPM
$1000 to $1150
99
92.11
12%
9%
11%
12%
15%
20%
$1150 to $1300
68
128.54
11%
10%
11%
12%
14%
17%
MORE THAN $1300
128
77.94
10%
8%
10%
13%
16%
23%
BUSINESS
MEDICARE FOCUSED
260
250.2
11%
10%
11%
14%
17%
26%
FOCUS
ALL OTHERS
166
85.2
11%
7%
10%
12%
15%
20%
GAIN/(LOSS)
REPORTED A GAIN
218
274.4
11%
8%
10%
12%
14%
16%
POSITION
REPORTED A LOSS
208
61.0
13%
10%
12%
15%
20%
31%
PSHPs
PSHPs
81
26.6
12%
9%
11%
14%
17%
25%
ALL OTHER MAOs
345
308.9
11%
9%
11%
13%
16%
23%

MILLIMAN REPORT
Medicare Advantage organizations: 16 November 2023
Financial results for 2022
Appendix 2: Definition of financial metrics
The financial metrics calculated for the purposes of this report include medical loss ratio (MLR), administrative loss
ratio (ALR), underwriting ratio (UW ratio), risk-based capital (RBC) ratio, and administrative cost PMPM. These
selected metrics focus primarily on the income statement values of the financial statement except for the RBC ratio,
which is a capital (or solvency) measure.
The financial metrics selected encompass five of the primary measures used by MAOs, regulators, and other
stakeholders to evaluate the financial performance of an MAO. The metrics are defined in greater detail below.
MEDICAL LOSS RATIO (MLR)
MLR is a common financial metric used to report and benchmark the financial performance of an MAO. The MLR
represents the proportion of revenue used by the MAO to fund claim expenses. The MLR is stated as a percentage,
with claim expense in the numerator and revenue in the denominator.
In terms of the statutory annual statement, the MLR was defined as follows:
MLR =
(TOTAL HOSPITAL AND MEDICAL EXPENSES + INCREASE IN RESERVES FOR A&H CONTRACTS) ÷ TOTAL REVENUE
WHERE:
TOTAL HOSPITAL AND MEDICAL EXPENSES: TITLE XVIII–MEDICARE (P.7, L.17, C.7)
INCREASE IN RESERVES FOR ACCIDENT AND HEALTH (A&H) CONTRACTS: TITLE XVIII–MEDICARE (P.7, L.21, C.7)
TOTAL REVENUE: TITLE XVIII–MEDICARE (P.7, L.7, C.7)
As noted previously, the MA Part D program includes prospective payments for LICS, CGDP, and federal
reinsurance. MAOs are not at risk for these programs. Neither the prospective payments nor the annual true-ups
should be reported as revenue. The Part D program also includes a risk corridor program where the MAOs and CMS
share in favorable or unfavorable prescription drug experience relative to a bid target. The risk corridor payments or
receivables should be included in revenue.
Actuaries and financial analysts use the MLR as a measure of premium adequacy. The target loss ratios (the claim
cost included in the premium or capitation rate) vary by state and populations enrolled. Additionally, there may be
reporting differences among MAOs as to what is classified as medical expense versus administrative expense.
As previously noted, the definition of MLR for the purposes of this report may not be consistent with other definitions.
UNDERWRITING RATIO
The UW ratio is the sum of the MLR and the ALR (defined below) subtracted from 100%. A positive UW ratio
indicates a financial gain, while a negative UW ratio indicates a loss. This financial metric is used to report and
benchmark the financial performance of an MAO in consideration of both medical and administrative expenses. The
UW ratio represents the funding after medical and administrative expenses. The UW ratio is stated as a percentage,
with total underwriting gain or loss in the numerator and revenue in the denominator.
In terms of the statutory annual statement, the UW ratio was defined as follows:
UW RATIO =
NET UNDERWRITING GAIN OR (LOSS) ÷ TOTAL REVENUE
WHERE:
NET UNDERWRITING GAIN OR (LOSS): TITLE XVIII–MEDICARE (P.7, L.24, C.7)
TOTAL REVENUE: TITLE XVIII–MEDICARE (P.7, L.7, C.7)
The UW ratio is focused on the income from operations and excludes consideration of investment income and
income taxes. The UW ratio requires interpretation and considerations similar in nature to the MLR and ALR metrics.
RISK-BASED CAPITAL RATIO (RBC RATIO)
The RBC ratio is a financial metric used by many insurance regulators to monitor the financial health or solvency of
MAOs. The RBC ratio represents the proportion of the required minimum capital that is held by the MAO as of a
specific date (the end of the financial reporting period). The RBC ratio is stated as a percentage or a ratio, with total
adjusted capital (TAC) in the numerator and authorized control level (ACL) in the denominator.

MILLIMAN REPORT
Medicare Advantage organizations: 17 November 2023
Financial results for 2022
The NAIC prescribes a specific formula to develop both the TAC and the ACL. Further, the MAO is subjected to
various action levels based on the resulting RBC ratio, as follows:
Company action level (TAC is between 150% and 200% of the ACL RBC)
Regulatory action level (TAC is between 100% and 150% of the ACL RBC)
Authorized control level (TAC is between 70% and 100% of the ACL RBC)
Mandatory control level (TAC is less than 70% of the ACL RBC)
In terms of the statutory annual statement, the RBC ratio was defined as follows:
RBC RATIO =
TOTAL ADJUSTED CAPITAL ÷ AUTHORIZED CONTROL LEVEL
WHERE:
TOTAL ADJUSTED CAPITAL: TOTAL ADJUSTED CAPITAL–CURRENT YEAR (P.28, L.14, C.1)
AUTHORIZED CONTROL LEVEL: AUTHORIZED CONTROL LEVEL–CURRENT YEAR (P.28, L.15, C.1)
Note: The RBC ratio is not unique to the MA line of business as it is calculated at the company level. Therefore, companies
reporting non-Medicare business will reflect composite RBC ratios for all lines of business within the reported legal entity.
ADMINISTRATIVE LOSS RATIO (ALR)
ALR is also a common financial metric used to report and benchmark the financial performance of an MAO. The ALR
represents the proportion of revenue that was used by the MAO to fund administrative expenses. The ALR is stated
as a percentage, with administrative expense in the numerator and revenue in the denominator.
In terms of the statutory annual statement, the ALR was defined as follows:
ALR =
(CLAIM ADJUSTMENT EXPENSES + GENERAL ADMINISTRATIVE EXPENSES) ÷ TOTAL REVENUE
WHERE:
CLAIM ADJUSTMENT EXPENSES: TITLE XVIII–MEDICARE (P.7, L.19, C.7)
GENERAL ADMINISTRATIVE EXPENSES: TITLE XVIII–MEDICARE (P.7, L.20, C.7)
TOTAL REVENUE: TITLE XVIII–MEDICARE (P.7, L.7, C.7)
The ALR requires interpretation and considerations similar in nature to the MLR metric outlined above, most notably
impacted by the state and federal taxes levied on MAOs across the different states.
ADMINISTRATIVE COST PMPM
The administrative cost PMPM is the second metric for analyzing administrative expenses because of the fixed cost
nature of certain components of the administrative expense. The administrative cost PMPM was defined as follows:
ADMIN PMPM =
(CLAIM ADJUSTMENT EXPENSES + GENERAL ADMINISTRATIVE EXPENSES) ÷ CURRENT YEAR MEMBER MONTHS
WHERE:
CLAIM ADJUSTMENT EXPENSES: TITLE XVIII–MEDICARE (P.7, L.19, C.7)
GENERAL ADMINISTRATIVE EXPENSES: TITLE XVIII–MEDICARE (P.7, L.20, C.7)
CURRENT YEAR MEMBER MONTHS: TITLE XVIII-MEDICARE (P.30 GT, L.6, C.8)
ADMINISTRATIVE EXPENSE CATEGORIES
The administrative expenses reported on the Underwriting and Investment Exhibit Part 3 Analysis of Expenses page
are categorized into 25 specific line items. We grouped these line items into five administrative expense categories to
better illustrate the components of administrative cost incurred by the MAOs. The subcategories were selected to be
intuitive groupings as well as meaningful with respect to their relative magnitudes. The following descriptions outline
each administrative expense category:
Human capital: Administrative costs associated with the employment of MAO staff.
Outsourcing: Administrative costs associated with functions outsourced to a third party.
Operating expenses: Administrative costs associated with the day-to-day costs of running the MAO.
Taxes and fees: Administrative costs associated with taxes and fees incurred by the MAO. We assigned payroll
taxes to the human capital category. We assigned real estate taxes to the operating expenses category.
Other expenses: Administrative costs for aggregate write-ins.

MILLIMAN REPORT
Medicare Advantage organizations: 18 November 2023
Financial results for 2022
FIGURE 12: ADMINISTRATIVE CATEGORY DEFINITION
ADMINISTRATIVE EXPENSE BREAKDOWN
U&I EXHIBIT PART 3
EXPENSES (COLUMNS 3-4)
HUMAN CAPITAL
SALARIES, WAGES, AND OTHER BENEFITS
LINE 2
BOARDS, BUREAUS, AND ASSOCIATION FEES
LINE 15
INSURANCE, EXCEPT ON REAL ESTATE
LINE 16
PAYROLL TAXES
LINE 23 .4
OUTSOURCING
AUDITING, ACTUARIAL, AND OTHER CONSULTING SERVICES
LINE 6
OUTSOURCED SERVICES INCLUDING EDP, CLAIMS,
AND OTHER SERVICES
LINE 14
OPERATING EXPENSES
RENT
LINE 1
COMMISSIONS
LINE 3
LEGAL FEES AND EXPENSES
LINE 4
CERTIFICATIONS AND ACCREDIDATION FEES
LINE 5
TRAVELING EXPENSES
LINE 7
MARKETING AND ADVERTISING
LINE 8
POSTAGE, EXPRESS, AND TELEPHONE
LINE 9
PRINTING AND OFFICE SUPPLIES
LINE 10
OCCUPANCY, DEPRECIATION, AND AMORTIZATION
LINE 11
EQUIPMENT
LINE 12
COST OR DEPRECIATION OF EDP EQUIPMENT AND SOFTWARE
LINE 13
COLLECTION AND BANK SERVICE CHARGES
LINE 17
GROUP SERVICE AND ADMINISTRATION FEES
LINE 18
REAL ESTATE EXPENSES
LINE 21
REAL ESTATE TAXES
LINE 22
INVESTMENT EXPENSES NOT INCLUDED ELSEWHERE
LINE 24
TAXES AND FEES
STATE AND LOCAL INSURANCE TAXES
LINE 23 .1
STATE PREMIUM TAXES
LINE 23 .2
REGULATORY AUTHORITY LICENSES AND FEES
LINE 23 .3
OTHER (EXCLUDING FEDERAL INCOME AND REAL ESTATE TAXES)
LINE 23 .5
OTHER
AGGREGATE WRITE-INS FOR EXPENSES
LINE 25
EXCLUDED
REIMBURSEMENTS BY UNINSURED PLANS
LINE 19
REIMBURSEMENTS FROM FISCAL INTERMEDIARIES
LINE 20

MILLIMAN REPORT
Medicare Advantage organizations: 19 November 2023
Financial results for 2022
About the authors
Phil Ellenberg is a healthcare consultant at Milliman. Mr. Ellenberg joined Milliman in 2016 and specializes in
predictive analytics and business intelligence.
Shyam Kolli is a principal and consulting actuary at Milliman and is a fellow of the Society of Actuaries and a member
of the American Academy of Actuaries. Mr. Kolli joined Milliman in 2010 and has nearly 20 years of healthcare-
related actuarial experience.
Tushar Makhija is an associate actuary at Milliman and is an associate of the Society of Actuaries and a member
of the American Academy of Actuaries. Mr. Makhija joined Milliman in 2017 and primarily works on Medicare
Advantage pricing.
Greg Sgrosso is a principal and consulting actuary at Milliman and is a fellow of the Society of Actuaries and a
member of the American Academy of Actuaries. Mr. Sgrosso joined Milliman in 2002 and has more than 20 years of
healthcare-related actuarial experience.
Acknowledgments
The authors further acknowledge Chris Pettit, FSA, MAAA, principal and consulting actuary, and Brad Piper, FSA,
MAAA, principal and consulting actuary, at Milliman, for their peer review and comments during the writing of this report.
Milliman is among the world’s largest providers of actuarial and
related products and services. The firm has consulting practices in
life insurance and financial services, property & casualty insurance,
healthcare, and employee benefits. Founded in 1947, Milliman is an
independent firm with offices in major cities around the globe.
milliman.com
CONTACT
Phil Ellenberg
phil.ellenberg@milliman.com
Shyam Kolli, FSA, MAAA
shyam.kolli@milliman.com
Tushar Makhija, ASA, MAAA
tushar.makhija@milliman.com
Greg Sgrosso, FSA, MAAA
greg.sgrosso@milliman.com
© 2023 Milliman, Inc. All Rights Reserved. The materials in this document represent the opinion of the authors and are not representative of the views of Milliman, Inc.
Milliman does not certify the information, nor does it guarantee the accuracy and completeness of such information. Use of such information is voluntary and should not be
relied upon unless an independent review of its accuracy and completeness has been performed. Materials may not be reproduced without the express consent of Milliman.
