
RESEARCH ARTICLE
UNDERSTANDING ECHO CHAMBERS AND FILTER BUBBLES:
THE IMPACT OF SOCIAL MEDIA ON DIVERSIFICATION AND
PARTISAN SHIFTS IN NEWS CONSUMPTION
1
Brent Kitchens, Steven L. Johnson, and Peter Gray
University of Virginia McIntire School of Commerce,
P.O. Box 400173, Charlottesville, VA 22904 U.S.A.
{bkitchens@virginia.edu} {[email protected]} {pet[email protected]}
Echo chambers and filter bubbles are potent metaphors that encapsulate widespread public fear that the use
of social media may limit the information that users encounter or consume online. Specifically, the concern
is that social media algorithms combined with tendencies to interact with like-minded others both limits users’
exposure to diverse viewpoints and encourages the adoption of more extreme ideological positions. Yet empi-
rical evidence about how social media shapes information consumption is inconclusive. We articulate how
characteristics of platform algorithms and users’ online social networks may combine to shape user behavior.
We bring greater conceptual clarity to this phenomenon by expanding beyond discussion of a binary presence
or absence of echo chambers and filter bubbles to a richer set of outcomes incorporating changes in both
diversity and slant of users’ information sources. Using a data set with over four years of web browsing
history for a representative panel of nearly 200,000 U.S. adults, we analyzed how individuals’ social media
usage was associated with changes in the information sources they chose to consume. We find differentiated
impacts on news consumption by platform. Increased use of Facebook was associated with increased informa-
tion source diversity and a shift toward more partisan sites in news consumption; increased use of Reddit with
increased diversity and a shift toward more moderate sites; and increased use of Twitter with little to no
change in either. Our results demonstrate the value of adopting a nuanced multidimensional view of how
social media use may shape information consumption.
Keywords: Echo chamber, filter bubble, diversity, polarization, slant, news, personalization
Introduction
1
Echo chambers and filter bubbles are potent metaphors that
encapsulate widespread public fear that the use of social
media may limit the information that users encounter or con-
sume online, thus failing to promote a shared experience of
free-flowing information. Specifically, the concern is that
social media algorithms combine with tendencies to interact
with like-minded others to create an environment that pre-
dominantly exposes users to congenial, opinion-reinforcing
content to the exclusion of more diverse, opinion-challenging
content. This intuitive understanding of echo chambers and
filter bubbles is well-accepted. Yet empirical evidence about
how social media and other digital platforms shape informa-
tion consumption is inconclusive. Despite decades of interest
in this phenomenon, researchers’ ability to analyze the preva-
lence or formation of echo chambers and filter bubbles is
stymied by a lack of consensus regarding their conceptuali-
zation and measurement.
There is growing concern that social media and other infor-
mation discovery platforms promote information-limiting
environments by shielding users from opinion-challenging
information, thereby encouraging users to adopt more extreme
1
Shaila Miranda was the accepting senior editor for this paper. Ofir Turel
served as the associate editor.
DOI: 10.25300/MISQ/2020/16371 MIS Quarterly Vol. 44 No. 4 pp. 1619-1649/December 2020 1619
Kitchens et al./Echo Chambers and Filter Bubbles
ideological positions. Indeed, there are aspects of popular
social media platforms that may foster information-limiting
environments. For instance, as with offline relationships,
people in online social networks interact most frequently with
like-minded others. In a study of 10.1 million U.S. Facebook
users with self-reported ideological affiliation, Bakshy et al.
(2015) found that more than 80% of these Facebook friend-
ships shared the same party affiliation. Accordingly, the news
and information sources that individuals discover through
their social relationships may also reflect a lack of ideological
diversity. Further, even within this already constrained choice
set, selective exposure theory predicts that individuals prefer
to consume opinion-reinforcing news sources over opinion-
challenging ones (Frey 1986). Garrett (2009) found support
for this tendency in a field experiment with 727 online news
readers: individuals expressed interest in reading online news
stories they perceived to be supportive of their existing
opinion and expressed disinterest in consuming opinion-
challenging stories. Finally, researchers have long expressed
concern about the potential for algorithmic filtering to reduce
the diversity of information sources that individuals are
exposed to, engage with, or consume (Van Alstyne and Bryn-
jolfsson 1996, 2005). Personalization technology is sensitive
to personal preferences; once a user engages with opinion-
reinforcing content, algorithmic filtering may constrain further
exposure to a narrower, more closely aligned range of content
(Pariser 2011; Stroud 2010). This, in turn, may foster the
adoption of more extreme opinions (Festinger 1964; Hart et
al. 2009).
Thus, there is a clear potential for the use of social media to
be associated with a narrowing of information diversity and a
partisan shift in the slant of news consumed by their users.
For example, Lawrence et al. (2010) found readers of political
blogs to be more ideologically segregated and more ideologi-
cally extreme than nonreaders. Likewise, Wojcieszak and
Mutz (2009) found that participants in online politics-related
groups were less likely to be exposed to political information
they disagree with (and more likely to be exposed to infor-
mation they agree with) than participants in many other
categories of online groups (e.g., hobby or leisure related).
Nonetheless, the prevalence and magnitude of information-
limiting environments may be overstated. Other studies have
shown social media platforms to be information-expanding.
Social media helps users discover new information sources,
thereby potentially expanding the diversity of viewpoints,
opinions, and information to which users are exposed. For
example, Flaxman et al. (2016) “uncover evidence for both
sides of the debate, while also finding that the magnitude of
the effects [are] relatively modest” (p. 298). Gentzkow and
Shapiro (2011) performed a large-scale analysis of web
browsing habits of U.S. adults, concluding that “ideological
segregation on the Internet is low in absolute terms” and that
the Internet exposes individuals to a broader range of view-
points than “face-to-face interactions with neighbors, co-
workers, or family members” (p. 1799). In summary, despite
a great deal of interest in the idea of echo chambers and filter
bubbles, empirical evidence to date is inconclusive as to
whether social media is information-limiting or information-
expanding.
We identify six key reasons contributing to why researchers
have reached conflicting conclusions about the existence of
echo chambers and filter bubbles, as well as the processes that
may lead to their formation. First, a fundamental issue in this
body of research is the lack of conceptual clarity, with vague
and conflicting definitions of constructs, processes, and
outcomes. Second, imprecise conceptualization has only
compounded issues of inconsistent measurement and
incommensurate research designs in prior studies, precluding
the systematic integration of findings. Most importantly, a
variety of online platforms have been studied either indepen-
dently or lumped together in aggregate, making it difficult to
ascertain the relationship between social factors, technology
features, and information-limiting environments. Third, empi-
rical results are also difficult to compare when they measure
disparate, nonequivalent outcomes, often measuring content
exposure, sharing, or generation, while consumption may be
more directly salient to the concerns surrounding information-
limiting environments. Fourth, as Shore et al. (2018) note,
one “likely reason for the conflicted nature of the literature is
that earlier work has generally focused too narrowly on
unrepresentative or incomplete data sets,” such as “focusing
on highly active users” (p. 850). Fifth, inferring the impact of
individuals’ technology use from analysis of population-level
distributions may suffer from either an ecological fallacy or an
aggregation bias (Freedman 1999). Finally, social media plat-
forms frequently adjust their algorithmic filters and rarely
disclose when those changes occur. The dynamic nature of
the phenomenon combined with a lack of transparency by
platform providers may limit the generalizability of empirical
results over time.
To further understand this much-debated phenomenon, we
propose the concept of information-limiting environments as
encapsulating the primary concerns regarding echo chambers
and filter bubbles—namely, that social network homophily
and algorithmic filtering constrain the information sources
that individuals choose to consume, shielding them from
opinion-challenging information and encouraging them to
adopt more extreme viewpoints. By identifying diversity and
partisan slant as distinct characteristics of information con-
sumption, we articulate how social media can shape informa-
tion consumption in ways that move beyond the simple
presence or absence of echo chambers and filter bubbles. We
use broadly representative data to investigate how three
1620 MIS Quarterly Vol. 44 No. 4/December 2020

Kitchens et al./Echo Chambers and Filter Bubbles
popular social media platforms vary in their impact on content
consumption by individual users, and thereby may or may not
contribute to underlying outcomes associated with
information-limiting environments. Through an analysis of
over four years of web browsing history for a representative
panel of nearly 200,000 U.S. adults, we demonstrate differ-
entiated impacts by platform and discuss these differences in
terms of the variation in platform features at the time.
Increased use of Facebook was associated with increased
information source diversity and a partisan shift in news site
visits. Increased use of Reddit was also associated with
increased diversity, but a moderating shift. Increased use of
Twitter had little to no association with changes in either
diversity or slant. Our results demonstrate the value of
adopting a more nuanced and multidimensional conceptua-
lization of how social media shapes information consumption.
Understanding Echo Chambers
and Filter Bubbles
Given the extensive range of approaches to conceptualizing,
measuring, and identifying echo chambers and filter bubbles,
they can be difficult to apply as precisely definable constructs
for academic research. To better understand these two terms,
it is useful to consider the genesis of each. The concerns arti-
culated by Cass Sunstein, a primary voice warning of echo
chambers (Sunstein 2001, 2017), originate from earlier
findings that group polarization—the individual and collective
adoption of more extreme views—occurs in intensive deliber-
ations by small groups of homogenous individuals on topics
of high relevance and concern (Sunstein 2002). He noted that
“widespread error and social fragmentation are likely to result
when like-minded people, insulated from others, move in
extreme directions simply because of limited argument pools
and parochial influences” (Sunstein 2002, p. 186). Extrapo-
lating from findings regarding small group dynamics, Sunstein
(2001) predicted that algorithmic filtering would also lead to
group polarization on a larger scale. Likewise, Eli Pariser’s
influential book The Filter Bubble (2011) predicted that
individualized personalization by algorithmic filtering would
lead to intellectual isolation and social fragmentation. His
thesis is succinctly captured in the book’s subtitle: What the
Internet Is Hiding from You. Both authors drew caution from
a scenario that Negroponte (1996) positively presented as the
“daily me”: information carefully selected to match individ-
ual preferences. But in contrast to Negroponte, both Sunstein
and Pariser made equally dire predictions that the use of
information discovery platforms would lead to information-
limiting environments with negative individual and societal
impacts.
Although both Sunstein and Pariser were concerned that
social media and other information discovery platforms would
shape what information individuals choose to consume—and,
ultimately, an individual’s viewpoints and opinions—they
differed on how this might happen. Pariser identified person-
alization technology as the primary mechanism, voicing
concern that it strengthens individual preferences for seeking
out opinion-reinforcing information to the exclusion of
opinion-challenging information (Frey 1986; Garrett 2009).
Pariser stressed the negative impacts of individual isolation in
creating epistemic bubbles where personal viewpoints persist,
unchallenged and untested. Sunstein stressed the potential of
technology to reinforce fragmentation at a larger scale, one
where people are not individually isolated, but instead form
groups in which individuals with similar ideological predilec-
tions interact exclusively with each other. Sunstein argued
that online interactions can reinforce ideological segregation
and thereby facilitate limited information pools that strengthen
preexisting biases, promote groupthink, and encourage adop-
tion of even more extreme viewpoints. In this way, Sunstein
was concerned with interactions among homogenous groups
that share a common social identity. Alternatively, Pariser
was concerned with individual isolation and a lack of shared
information in opinion formation. From Pariser’s perspective,
an individual isolated in their own personalized information
bubble still may suffer from the negative impacts of limited
information, even if this isolation makes them immune from
the social pressures that reinforce group solidarity and
engender polarizing groupthink. Despite these differences in
perspectives, both Pariser and Sunstein argued that the
remedy for information-limiting environments is individual
consumption of ideologically diverse content that encom-
passes opinion-challenging viewpoints.
These conceptualizations of echo chambers and filter bubbles
are reactionary, in that they portray not the creation of an
observable outcome, but rather the absence of an idealized
one. This ideal is not well defined, however, other than the
general normative assertion that individuals should be
exposed to and consume opinion-challenging information.
The quantity of opinion-challenging information that an
individual should consume and the degree to which it should
challenge their opinions is left ambiguous, rendering it all but
impossible to determine if someone is actually within an echo
chamber or filter bubble. Further, it is doubtful whether this
ideal of a well-informed public with rigorously examined
opinions has ever existed. For example, before the creation
of Internet-enabled personalization technology, news and
information was disseminated largely via newspapers, maga-
zines, radio, and TV broadcasts that catered to ideologically
diverse audiences. Even then, “a number of studies …
indicate[d] that persuasive mass communication functions far
more frequently as an agent of reinforcement than as an agent
MIS Quarterly Vol. 44 No. 4/December 2020 1621
Kitchens et al./Echo Chambers and Filter Bubbles
of change” (Klapper 1960, p. 15). With commonly vague and
reactionary conceptualizations, echo chambers and filter
bubbles are certainly powerful metaphors, but are ill-defined
for use as rigorous academic constructs.
Echo chambers and filter bubbles are also often depicted as
something that an individual (or group) either is in, or is not—
a simplistic binary that is unnecessarily reductionist.
Focusing solely on whether or not individuals consume
opinion-challenging information sources neglects more
nuanced ways in which technology use may shape the con-
sumption of information sources. For example, even though
other impacts are quite plausible, Bakshy et al. (2015)
considered only the consumption of ideologically discordant
content (e.g., a liberal consuming conservative news or vice
versa) in concluding that algorithmic ranking has limited
impact on news consumption.
Furthermore, this emphasis on consumption of opinion-
challenging and ideologically discordant information may be
misplaced. Groupthink, extreme viewpoints, and intellectual
isolation can persist even when opinion-challenging informa-
tion is readily available. Individuals and groups frequently
adopt extreme opinions despite being confronted with chal-
lenges to their viewpoints. For example, studies have found
that exposure to divergent viewpoints may fail to have a
moderating effect and can even catalyze a polarizing backlash
that hardens existing ideological positions (Bail et al. 2018;
Stroud 2010). Further, some individuals—particularly highly
politically-engaged ones—may purposely seek out ideolo-
gically discordant information sources to gain awareness of
opposing viewpoints while remaining highly antagonistic to
them (Shore et al. 2018), a condition referred to as affective
polarization (see Iyengar et al. 2019).
In summary, discourse regarding echo chambers and filter
bubbles has often been both reactionary and reductionist.
Consumption of ideologically discordant content that includes
opinion-challenging viewpoints is neither a necessary nor a
sufficient remedy for the fundamental ills associated with
echo chambers and filter bubbles. Thus, we conclude that
although Sunstein and Pariser identified key mechanisms that
may contribute to information-limiting environments, a richer
conceptualization of potential outcomes is needed to under-
stand how social media platforms can impact the content that
users choose to consume.
Constituent Characteristics of Echo
Chambers and Filter Bubbles
Although there is no consensus definition for echo chambers
or filter bubbles, in considering the range of descriptions we
identify two constituent characteristics that stand out. The
first is a lack of information diversity due to restriction of
information sources. In echo chambers, “individuals are
exposed only to information from like-minded individuals”
(Bakshy et al. 2015, p. 1130), that “confirms their previously-
held opinions” (Shore et al. 2018, p. 850), and “is devoid of
other viewpoints” (Garrett 2009, p. 279). Filter bubbles are
a “unique universe of information for each of us” (Pariser
2011, p. 9), “devoid of attitude-challenging content” (Bakshy
et al. 2015, p. 1130), where “individuals only see posts that
they agree with” (Lazer 2015, p. 1090). Reduced information
diversity exaggerates confirmation bias—the individual and
collective tendency to seek out information that supports
preexisting beliefs (Nickerson 1998). It also facilitates ideo-
logical groupthink—a collective manifestation of closed-
mindedness and an overestimation of the value of collective
beliefs that are reinforced by pressure towards uniformity
(Janis 1982). Narrowing of information sources is prob-
lematic, as “exposure to differing political views increases
people’s knowledge of rationales for political perspectives
other than their own and also fosters political tolerance”
(Mutz and Martin 2001, p. 140).
Second, both echo chambers and filter bubbles are commonly
characterized by ideological segregation (the tendency of
individuals to associate with others who share their view-
points) and by partisan polarization (the adoption of more
extreme views). Echo chambers are associated with “frag-
mentation of users into ideologically narrow groups” (Shore
et al. 2018, p. 850), with “political fragmentation and social
polarization” (Garrett 2009, p. 278), and with “segregation by
interest or opinion [that] will … increase political polari-
zation” (Dubois and Blank 2018, pp. 1-2) and “foster social
extremism” (Barberá 2015, p. 86). Similarly, filter bubbles
are a “centrifugal force pulling us apart” (Pariser 2011, p. 10),
“in which algorithms inadvertently amplify ideological segre-
gation” (Flaxman et al. 2016, p. 299). In this way, the
increasing ability to interact online is viewed not as a unifying
force but, rather, one that may tear apart the fabric of society
as individuals adopt more extreme views.
In summary, we argue that while echo chambers and filter
bubbles are potent, flexible metaphors that have broadly
captured the public’s imagination and serve as a distillation of
widespread fears, their vague and disparate conceptualizations
make them difficult to study. To make these attractive meta-
phors concrete, we propose that research into information-
limiting environments requires a more nuanced focus on the
separate characteristics of information source diversity and
information source slant. Information source diversity
reflects separation, variety, and disparity among information
sources an individual consumes (see Harrison and Klein
2007). A change in the consumption of information sources
1622 MIS Quarterly Vol. 44 No. 4/December 2020
Kitchens et al./Echo Chambers and Filter Bubbles
may lead to a broadening increase or a narrowing decrease in
information source diversity. Information source slant
reflects the dominant ideological perspective provided by
information sources an individual consumes. A change in
consumption of information sources may lead to a partisan
shift towards more extreme information sources or a moder-
ating shift toward more centrist ones. Our objective is to
examine how social media use may be associated with
changes in the diversity and slant of the information sources
an individual chooses to consume.
Categorizing Changes in
Information Consumption
Information Source Diversity
Information source diversity is an area of interest across aca-
demic disciplines, including management, communications,
and political science. Receiving information from diverse
sources can help individuals better understand the world
around them, develop more robust opinions, and make better
decisions (Jehn et al. 1999; Mutz and Martin 2001; Van
Alstyne and Brynjolfsson 1996). Information source diversity
captures the idea that the value of information sources derives
from providing nonredundant information and alternative
viewpoints. There are many ways to conceptualize and mea-
sure diversity (see Harrison and Klein 2007; Page 2010).
Most approaches involve summarizing how elements of
interest, such as unique information sources, are allocated
along a continuum or across a set of categories (McDonald
and Dimmick 2003). We identify constructs related to the
diversity of information sources an individual chooses to con-
sume, following Harrison and Klein’s (2007) dimensions of
separation, variety, and disparity. Together, these constructs
provide a holistic view of information source diversity (see
Table 1 for a summary). We also consider a precursor to
these measures: information source quantity (the number of
unique information sources an individual consumes). Al-
though this construct does not reflect how information sources
may vary in the kinds of information they provide, as the
quantity of information sources increases, so does the poten-
tial for nonredundant information.
Separation describes the degree of diversity along a single
lateral dimension (Harrison and Klein 2007)—such as the
dimension of political ideology. Differentiation by ideolo-
gical slant is particularly evident in the contemporary U.S.
media landscape (Jurkowitz et al. 2020) where there is
increasing separation of information sources by dominant
ideological perspective (Flaxman et al. 2016). This speciali-
zation allows reliable categorization of information sources
based on the predominant viewpoint of typical content
(Gentzkow and Shapiro 2011; Shore et al. 2018). Information
source dispersion reflects ideological separation among a set
of information sources an individual chooses to consume
(Shore et al. 2018). When an individual consumes informa-
tion sources from a narrow ideological range, they are less
likely to be exposed to a diversity of viewpoints and opinions
than when they read sites encompassing a broader range.
However, dominant ideological perspectives may be insuf-
ficient for understanding differences among information
sources. For example, some news and information sources are
not overtly ideological, and even among those with similar
ideological slant, there are other bases for differentiation.
Drawing on the concept of interorganizational competition
and niche overlap theory (Burt 1992; Sohn 2001), we con-
ceptualize information source variety as reflecting how likely
a set of information sources is to provide nonredundant
information along an assortment of dimensions. Similar to the
idea of brokerage across structural holes in a communication
network (Burt 1992), when an individual consumes multiple
information sources with minimally overlapping audiences,
they are likely to be exposed to more nonredundant infor-
mation and divergent viewpoints than if they consumed
multiple information sources with substantial audience over-
lap. Thus, increased information source variety reflects the
consumption of a broader range of knowledge, expertise, and
unique information.
Finally, disparity complements separation and variety as an
additional form of diversity. Disparity is frequently used to
assess income inequality, but may also be applied to the distri-
bution of attention (e.g., Li et al. 2019). In considering
consumption of multiple information sources, an increasing
disparity of the time spent per source reflects a concentration
of attention that effectively reduces diversity. For example,
if an individual regularly visits five information sources but
spends the preponderance of their time with only two of them,
they are less likely to consume nonredundant information than
when they give all five equal attention. Thus, information
source parity reflects equality of attention given to different
information sources.
Information Source Slant
In addition to considering changes in information source
diversity, we focus on the complementary, yet distinct, con-
cept of changes in information source slant—where slant
represents the dominant ideological perspective of the infor-
mation sources an individual consumes. This concept relates
to the conclusion that interaction among like-minded
individuals can lead to more extreme (less centrist) opinions
(Sunstein 2009). Such individual-level change is a form of
MIS Quarterly Vol. 44 No. 4/December 2020 1623

Kitchens et al./Echo Chambers and Filter Bubbles
Table 1. Dimensions of Information Consumption
Dimension Construct Description Categorization
Diversity
Information source
quantity
Quantity of unique information sources
consumed
None
Information source
dispersion
Separation of information sources along a
single ideological dimension
Slant (continuous)
Information source
variety
Variety of information among information
sources
Information source audience
overlaps (continuous)
Information source parity
Equality of time spent consuming
information sources
Time (continuous)
Slant Information source slant
Dominant ideological perspective among
information sources
Slant (continuous)
Diversity
and slant
Cross-cutting content
consumption
Proportion of information sources with
opposing viewpoints
Slant (discrete categories)
polarization that reflects a process of shifting or strengthening
“one’s original position” (Stroud 2010, p. 557) “further in the
direction of … original views” (Mutz 2006, p. 227). Yet, a
partisan shift is but one possibility; the slant of news sources
consumed could also shift in a centrist direction. We define
a shift in slant in terms of differences in an individual’s
consumption choices between points in time. In comparing
the information sources consumed at various times, a change
in the dominant ideological position towards a more centrist
perspective represents a moderating shift and a change
towards the extreme represents a partisan shift.
The concept of polarization (and its less frequently articulated
converse, moderation) is multifaceted. We identify three
alternative conceptualizations of polarization that encompass
antecedents or consequences of individual information source
consumption. First, social polarization is reflected in par-
ticular patterns of interactions and affiliations. For example,
the preference of individuals to maintain social relationships
with like-minded others manifests as modularity in social
networks (Baldassarri and Bearman 2007). This homophilous
tendency, which has been observed in Facebook friendships
(Bakshy et al. 2015) and in interactions among Twitter users
(Bright 2018), may impact individuals’ consumption
behaviors. Second, attitudinal polarization represents seg-
mentation of beliefs and attitudes (Baldassarri and Bearman
2007; Boxell et al. 2017). For example, individuals are more
trusting of and more likely to consume information sources
that align with their ideological views (Adamic and Glance
2005; Jurkowitz et al. 2020). At the group or population
level, this may be observed as audience fragmentation in
information sources that individuals engage with and consume
(Jacobson et al. 2016; Lawrence et al. 2010). Third, affective
polarization is a phenomenon of animosity between
individuals in opposing political parties that stems from parti-
sanship as a social identity (Iyengar et al. 2019). Individuals
with high affective polarization may frequently engage with
or consume opinion-challenging content, but remain un-
changed in or even strengthen their views as a result. This is
consistent with users who “read at least some information
from both sides of the political spectrum, but only tweet out
information consistent with their own side” (Shore et al. 2018,
p. 852).
In summary, polarization is an individual-, group-, and
population-level phenomenon encompassing static states and
dynamic processes (Mutz 2006). In the discussion of echo
chambers and filter bubbles, polarization is a frequently raised
theme, yet often without precise conceptualization or distinc-
tion among its many forms. Social, attitudinal, and affective
polarization are all potential antecedents or consequences of
the content a user is exposed to, engages with, and consumes.
To better understand how social media platforms may influ-
ence information consumption, we focus on the individual-
level behavioral outcome of partisan or moderating shifts in
slant of information a user consumes across periods of varied
platform use.
Cross-Cutting Content Consumption
Cross-cutting content consumption measures the extent to
which an individual consumes information sources that
provide ideologically discordant information (Bakshy et al.
2015). Assuming that an individual’s attitudes and behaviors
are grounded in and reflect a dominant ideological viewpoint,
an information source is considered cross-cutting when there
is sufficient ideological difference between the slant of the
information source and the individual’s dominant viewpoint
(Lawrence et al. 2010). When cross-cutting consumption is
high, an individual is regularly consuming information
sources that are opinion-challenging. A low amount of cross-
1624 MIS Quarterly Vol. 44 No. 4/December 2020

Kitchens et al./Echo Chambers and Filter Bubbles
Change in
Information
Source
Diversity
Change in Information Source Slant
Moderating Shift
H2B: more centrist No Change
Partisan Shift
H2A: more extreme
Narrowing
H1A: less
diverse
No change
Broadening
H2B: more
diverse
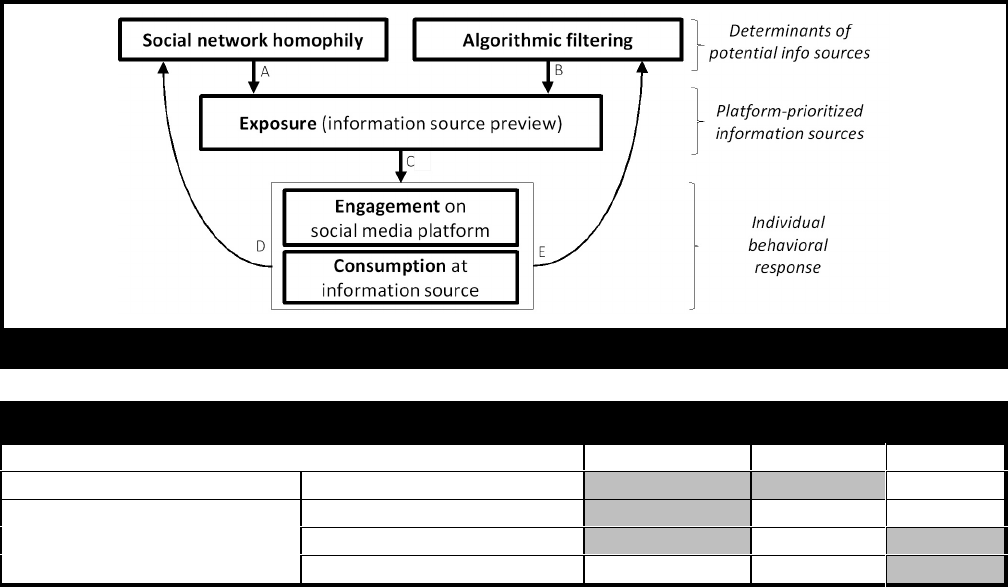
In each scenario, the gray bubble represents the original mean slant (left-right position) and diversity (size) of news consumed by an example
user. This user’s original consumption is liberal, as it is left of the center as denoted by the vertical hash along the axis. The white bubble
represents the changed consumption of the end user under a treatment condition (e.g., in a period of higher social media use).
Figure 1. Categorizing Changes in Information Consumption
cutting consumption is consistent with being in an
information-limiting environment. However, a focus on
cross-cutting content can distract researchers from under-
standing more modest shifts in consumption, such as a highly
conservative user reading more moderately conservative
news.
Decreasing consumption of cross-cutting information sources
results in both narrowed information diversity and a partisan
shift. Alternatively, increasing cross-cutting content con-
sumption concurrently results in both a broadening of infor-
mation diversity as well as a moderating shift in information
source slant. Because the cross-cutting consumption construct
conflates both diversity and slant of information sources, we
argue that it is a poor measure of either and that it fails to
capture the nuance provided by their separate measurement.
Categorizing Information Source Consumption
Considering changes in the diversity and slant of information
sources as two separate dimensions provides a richer cate-
gorization of the potential impacts of social media platforms
on information source consumption. As depicted in Figure 1,
three possible changes in information source diversity
(narrowing, no change, broadening) can combine with three
possible changes in information source slant (moderating
shift, no change, partisan shift) for nine potential scenarios
(see Figure 1).
Explicitly considering changes in both dimensions is essential
for moving beyond a simplistic conclusion that information-
limiting environments either do or do not exist and leads to a
more nuanced understanding of how social media use could
be associated with a wide range of outcomes. Of the scen-
arios shown in Figure 1, any of those involving a narrowing
decrease in information source diversity (the top row), as well
as those involving a partisan shift (the right-hand column),
could be considered as information-limiting environments; yet
each has unique characteristics and implications. Research
into how technology shapes information consumption would,
therefore, be enhanced by independently considering changes
in both information source diversity and slant when devel-
oping theory, designing studies, and selecting measures.
MIS Quarterly Vol. 44 No. 4/December 2020 1625

Kitchens et al./Echo Chambers and Filter Bubbles
Information Source Consumption
To frame our investigation of how social media platforms
shape the information sources an individual chooses to con-
sume, we provide a general model of how social network
homophily, algorithmic filtering, and individual behavioral
responses can lead to variation in information source con-
sumption. We then detail how this model relates to three
popular social media platforms. Finally, we hypothesize how,
based on these factors, social media use may be associated
with changes in information diversity and slant in information
source consumption.
As depicted in Figure 2, social network homophily (path A)
and algorithmic filtering (path B) are two key determinants of
the information sources a social media to which a user is
exposed. Individuals’ social networks vary widely in size, the
density of shared ties, and the frequency of interactions.
Likewise, social media users vary in their social networks,
including who they are connected with on a platform. The
preponderance of information sources shared on social media
is generated by platform users. Yet, there is wide variability
among platforms in how user-generated content is organized,
the extent to which algorithmic filtering is used in prioritizing
which content is displayed, and the factors considered in that
prioritization. Once a platform presents a user with a preview
of potential information sources, the user has the opportunity
(path C) to engage on that platform and/or to “click-through”
to the external source itself. Additionally, an individual’s
response to content exposure can serve as an input for subse-
quent algorithmic filtering (path E) and influence who that
user affiliates with in the future (path D).
Next, we build on Figure 2 to discuss how social media plat-
forms vary in the prioritization of information sources that
users are exposed to. As noted in Table 2, Facebook is an
example of a platform with high levels of social network
homophily and extensive algorithmic filtering. Facebook
determines what content to show users based on an estimated
likelihood of engagement (Bakshy et al. 2015; Vaidhyanathan
2018). In deciding what to present, Facebook chooses from
among recent posts made by others in a user’s social network
(e.g., by Facebook “friends”). Facebook considers an indi-
vidual’s past engagement history as well as the overall
popularity of content. Thus, algorithmic filtering on Face-
book is highly personalized: even if two users have an
identical set of Facebook friends, what each user sees may
vary considerably based on their prior engagement with
similar content.
Twitter also has a high level of social network homophily.
Twitter users build their online social network by identifying
other Twitter accounts to “follow.” For the first 10 years of
its existence (from 2006 to mid-2016), Twitter presented a
primary timeline of Tweets posted by others in a user’s social
network (those whom they “follow”) in reverse chronological
order. During this period, algorithmic filtering was minimal:
two users who followed the same Twitter accounts would see
the same content, in the same order. Recently, Twitter has
implemented more extensive algorithmic filtering (similar to
Facebook). However, the data analyzed in this study was col-
lected prior to this implementation, and therefore provides a
contrast to Facebook.
Finally, Reddit is an example of a platform that is primarily
interest-based, with content shared by users through a hier-
archy of topic-based communities (a.k.a. subreddits). Users
self-identify their interests by joining these communities. Users
may directly communicate with one another, but these
connections are not used to filter content. Indeed, Reddit
performs minimal algorithmic filtering, merely prioritizing
content based on popularity determined by up- and down-
votes. A Reddit user can choose to sort and filter content
based on recency or popularity, but members of the same
communities see the same content by default (Jürgens and
Stark 2017).
In summary, because social media platforms embody a wide
variety of features and uses, it is not reasonable to make
blanket statements regarding how their use may produce
information-limiting environments. It is more useful to discuss
how—through the interplay of social networks, algorithmic
filtering, and individual choices—the mechanisms in Figure 2
may be associated with changes in diversity and slant in the
information sources an individual chooses to consume.
Because of conflicting theoretical claims and mixed empirical
evidence to date, we divide studies into rival camps and
articulate competing hypotheses (e.g., Gray and Cooper 2010).
While only one of each pair of hypotheses can survive a given
empirical test, the reality that there are likely many different
boundary conditions—such as differentiated effects by
technology platform—suggests the need for a systematic
program of research over time to identify the conditions under
which each effect may dominate (Burton-Jones et al. 2017).
Narrowing Diversity
The argument that social media use is associated with nar-
rowing diversity in information source consumption begins
with the observation that social networks frequently exhibit
ideological homophily (e.g., Bakshy et al. 2015; Himelboim et
al. 2013). Individuals are more likely to affiliate with others
who share similar experiences, perspectives, and opinions. To
the extent that individuals are part of ideologically segregated
social networks, the content posted by others
1626 MIS Quarterly Vol. 44 No. 4/December 2020
Kitchens et al./Echo Chambers and Filter Bubbles
Figure 2. Social Media Use and Information Source Consumption
Table 2. Determinants of Prioritization of Information Sources by Social Media Platform
Facebook Twitter Reddit
Social Network Homophily Platform social graph High High Low
Algorithmic Filtering
Engagement history High Low
†
Low
Content popularity High Low High
Topic-based Low Low High
†
Low for chronological Twitter feed before mid-2016, high for curated feed initiated in mid-2016.
with whom they interact on social media may also be ideolo-
gically constrained (path A in Figure 2). For example, a study
of news links in partisan Facebook pages showed that com-
menters in both liberal- and conservative-oriented groups
posted links to a small number of information sources, with
little overlap between the two groups (Jacobson et al. 2016).
To the extent that a social media platform algorithmically
filters or prioritizes content based on users’ prior engagement
(path B), users may also be presented with a narrower range
of content (Bozdag and van den Hoven 2015; Pariser 2011).
When this constrains information sources available to engage
with (path C) it can also create a feedback loop (path D, E)
that further constrains variation in subsequent exposure
(Prawesh and Padmanabhan 2011). Algorithmic filtering and
prioritization based on general popularity can also lead to a
narrowing of information sources in a rich-get-richer dynamic
(Welch et al. 2011). Further, among information sources to
which users are exposed, individuals’ preference to engage
with opinion-confirming sources rather than opinion-
challenging ones—referred to as selective exposure theory
(e.g., Garrett 2009)—may reduce engagement with and con-
sumption of diverse information sources (paths C). Indeed,
Schmidt et al. (2017) found “that the more active a user is, the
more the user tends to focus on a small number of news
sources” (p. 4). Bakshy et al. (2015) concluded that restricted
information diversity occurs in part due to algorithmic filter
effects on exposure (path B), but more so because of indi-
vidual choices in engagement and consumption (paths C, D,
E). Thus, we propose:
H1a: Social media use is associated with a nar-
rowing in the diversity of information
source consumption.
Broadening Diversity
A contrasting argument holds that the social media use may be
associated with a broadening of information diversity in infor-
mation source consumption. Although the argument follows
similar logic and pathways as the narrowing effect (H1a), it
arises from different assumptions about ideological segrega-
tion in online social networks, associated content exposure,
and individual preferences in content engagement and
consumption.
There is some evidence that ideological segregation may be
less prevalent in online relationships than it is in offline ones.
As such, online social networks may even broaden the ideo-
MIS Quarterly Vol. 44 No. 4/December 2020 1627
Kitchens et al./Echo Chambers and Filter Bubbles
logical range of social interactions (path A). For example,
Goel et al. (2010) found that people’s ties on Facebook often
included others who held different ideological views—for
example, through familial, professional, and hobby-related
associations. These diverse social interactions can increase
individuals’ incidental exposure to ideologically diverse infor-
mation sources (path A) (Fletcher and Nielsen 2016).
Platforms that filter and curate information sources relative to
topics of interest (path B) must cater to a variety of users.
Heterogeneity of user interests provides incentives for these
algorithms to increase the diversity of information sources.
This works against the rich-get-richer popularity bias men-
tioned previously and leads to increased variety (Fortunato et
al. 2006). This rationale applies to generic filtering algo-
rithms, but not necessarily to personalized filtering (path G,
D). Personalized filtering algorithms are essentially sophisti-
cated recommender systems, a domain in which the novelty-
accuracy tradeoff has long been a well-known and researched
issue—intuitively, “it would be almost always correct, but
useless, to recommend bananas, bread, milk, and eggs” to
grocery shoppers (Herlocker et al. 2004, p. 14). Under-
standing the value of novel information, recommender
systems are commonly designed with diversity, serendipity,
coverage, and related objectives in mind, all of which would
increase the breadth of information sources to which users are
exposed (Kaminskas and Bridge 2016).
Finally, as a platform for information discovery, a funda-
mental purpose of social media is to provide access to
information sources otherwise unknown to users. Because
individuals have a limited capacity for search and exploration,
it has long been recognized that intermediate tools are needed
in order to overcome the difficulty of finding information
(Bakos 1997). Although there are a variety of use cases for
social media, the value of these platforms is broadly derived
from their ability to connect users with content that is infor-
mative, engaging, or entertaining. It stands to reason, there-
fore, that platform usage may be associated with discovery of
novel information sources that enhance an individual’s
information source diversity. This assertion is supported by
the finding that news site visits from social media platforms
were more diverse than direct visits (Flaxman et al. 2016). In
summary, we propose:
H1b: Social media use is associated with a
broadening in the diversity of information
source consumption.
Partisan Shift
The argument that social media use is associated with a
partisan shift in information source consumption is difficult to
disentangle from the argument for the narrowing of infor-
mation diversity (H1a above). It is therefore unsurprising that
the consumption of cross-cutting content, which shifts both
information diversity and slant, is viewed as an antidote to
information-limiting environments. Indeed, researchers often
discuss a narrowing of diversity and a partisan shift in infor-
mation sources as occurring together. For example, the large-
scale study of Facebook usage by Schmidt et al. (2017) con-
cluded that “users [tend] to limit their exposure to a few sites”
and “there is major segregation and growing polarization in
online news consumption” (p. 4). Moreover, an important
argument for a partisan shift follows a logic similar to that for
narrowing of diversity: exposure to opinion-reinforcing
information is high due to ideological segregation (path A),
individuals prefer opinion-conforming information (path C),
and algorithms reinforce these preferences (paths B, E).
Bakshy et al. (2015, p. 2) found the “factor decrease in the
likelihood that an individual clicks on a cross-cutting article
relative to the proportion available in News Feed to be 17%
for conservatives and 6% for liberals” (path C). This reduc-
tion in cross-cutting content consumption contributes to both
a narrowing of information diversity as well as a partisan
shift.
We identify three distinct arguments for how partisan shifts
may occur independently of narrowing. First, individuals who
primarily interact with like-minded others online (path A) are
likely to experience the same group solidarity and in-group
identification that occur offline, with a polarizing effect on
ideological beliefs (e.g., Schkade et al. 2007; Sunstein 2009).
Second, a Twitter experiment by Bail et al. (2018) demon-
strated that exposure to opposing viewpoints resulted in a
partisan shift in engagement (path C), albeit only for conser-
vatives. However, Bail et al.’s experimental conditions were
extreme and may not represent either typical use of social
media or typical patterns of ideological content exposure.
Third, social media platforms may include partisan content
created and promoted by zealots or malicious actors at-
tempting to convince others or actively sow discord through
Facebook groups, Twitter hashtags, and Reddit subreddits
(e.g., Allcott and Gentzkow 2017; Lazer et al. 2018). In
summary, we propose:
H2a: Social media use is associated with a
partisan shift in the slant of information
source consumption.
Moderating Shift
However, other research suggests the opposite effect. Just as
narrowing of information diversity and a partisan shift are
often complementary, so too is the opposite combination of
1628 MIS Quarterly Vol. 44 No. 4/December 2020
Kitchens et al./Echo Chambers and Filter Bubbles
broadening diversity and a moderating shift. The studies in
support of broadening of information diversity (in H1b above)
often assume that broadening occurs through exposure to
opinion-challenging, cross-cutting content.
To the extent that individuals’ online social networks are
diverse, users may experience increased exposure to moder-
ating news sources (path A). Based on experimental manipu-
lation of social endorsements and online news consumption
choices, Messing and Westwood (2014) concluded that “the
mere presence of social endorsements reduced partisan
selectivity to levels indistinguishable from chance” (p. 1056).
Thus, when an individual observes others in their social net-
work engaging with content—a form of social endorsement—
they are more likely to engage with it themselves, regardless
of perceived slant. Selective exposure to opinion-confirming
content appears to be even lower when mediated by online
platforms than through more direct interaction with others,
causing users to encounter information with dissimilar poli-
tical views (Mutz and Martin 2001, p. 98).
Filtering and prioritization algorithms (path B) may also show
users more mainstream, moderate content because it is typi-
cally more popular and commercially viable (Cooper 2003).
Particularly if a platform is ad-supported, there may be incen-
tive to avoid polarizing content in order to appease advertisers
(Gabszewicz et al. 2002). For similar reasons, platforms may
also choose to present a balance of ideological perspectives
(Fletcher and Neilsen 2018b).
There is also direct empirical evidence consistent with a
moderating effect of social media use. For example, a
population-level analysis of technology use found that the
demographic groups most likely to use social media were also
the least likely to be ideologically segregated (Boxell et al.
2017). Shore et al. (2018) offer empirical evidence of a
potential moderating effect of platform usage, finding that
Twitter users typically share news links that are more centrist
than the news links to which they are exposed (thereby
creating more opportunity for others to encounter centrist
news through). Thus, we propose:
H2b: Social media use is associated with a
moderating shift in the slant of information
source consumption.
Data and Methods
Research Setting
To investigate how social media use is associated with infor-
mation source consumption, we obtained data from Comscore,
a leading provider of digital audience measurement services.
They recruit and compensate a demographically represen-
tative sample of active U.S. Internet users who install an
apparatus that automatically records and reports granular
Internet usage. This apparatus enables Comscore to gather
accurate data about the timing and duration of all web pages
visited by each panelist, including use of social media and
visits to news sites. Companies widely trust this data to accu-
rately reflect the reach and effectiveness of marketing efforts,
similar to Neilsen ratings for television. Although they
usually report audience data in aggregate format, we obtained
de-identified user-level clickstream browsing data for over 3
million U.S. adults who were panelists between January 2012
and June 2016.
Panel membership rotates, with existing users leaving and new
users joining the panel at variable intervals. To understand
within-person behavioral trends over time, we limited our
analysis to users who remained on the panel for at least 365
consecutive days. Although social desirability bias could be
a concern as users are aware of the monitoring they agreed to,
we empirically established that panel users continued to
browse all manner of sites and conclude that it is unlikely that
users systematically altered their browsing behaviors.
A limitation of our data set is that it only includes browsing
behavior originating from desktop and laptop computers
(PCs); the data set does not include mobile device usage.
While it would be optimal to have a view of online usage that
encompasses mobile devices, this data set can still provide
robust insights into the association between social media use
and news site visits. An analysis of similar Comscore data by
Mitchell and Jurkowitz (2014) found that online news con-
sumption patterns were similar for PCs and mobile devices.
Also, we conducted an additional survey to better understand
mobile and PC device visits to social media and news sites.
We randomly surveyed 426 individuals through Qualtrics
(results available upon request), asking respondents how often
they read news and access social media on desktops or laptops
(PC), as well as smartphones or tablets (mobile). The number
of users who access news on various devices is almost iden-
tical, with 82% of users reading news on a PC at least weekly,
compared to 83% reading news on mobile devices at least
weekly. The difference is only slightly more pronounced for
accessing social media, with 88% doing so on mobile at least
weekly, compared to 73% by PC. Further, we found no evi-
dence of significant substitution of one device type for the
other. It is important to note that this survey was conducted
in February 2020, whereas our data encompasses panelists’
web site visits from 2012 through mid-2016. Mobile device
usage has increased significantly from the years 2012–2016,
while PC usage has largely remained stable, particularly for
news consumption (Walker 2019). In summary, it is reason-
MIS Quarterly Vol. 44 No. 4/December 2020 1629

Kitchens et al./Echo Chambers and Filter Bubbles
Table 3. Independent Variables
Measure Description
Facebook referrals
Number of visits to news sites attributable as referrals from each platform; that is, web pages in
the domains facebook.com, reddit.com, and twitter.com (count)
Reddit referrals
Twitter referrals
Time on Facebook
Duration of all visits to each platform (hours)
Note: In all models, this is Log
2
transformed such that the coefficient represents the impact on
the odds ratio of a doubling of time spent.
Time on Twitter
Time on Reddit
Direct visits Number of direct visits to news sites (count)
Total time online Total duration of all website visits (hours). Transformed Log
2
in all models.
Table 4: Outcome Measures for an Individual’s Within-Period News Site Visits
Dimension Construct Measure Description Minimum Maximum
Diversity
Information
source
quantity
Distinct news
sites
Number of unique news
sites visited (count)
No news site visits
Visit all 177 news
sites in the sample
Information
source
dispersion
Slant
dispersion
The time-weighted standard
deviation of political slant of
news sites visited
All visited news sites
have the same
political slant
50% of visits to the
most liberal news
site, 50% to the
most conservative
Information
source parity
Reverse Gini
Index
(1 - Gini Index)*100
calculated based on time
spent on each visited news
site (0 to 100 range)
One news site
predominates with
minimal time on
others
An equal amount
of time spent at
multiple news sites
Information
source variety
Audience
variety
Time-weighted mean variety
of news site visits based on
the frequency of overlapping
site visitors (0 to 100 range)
Visit a small set of
news sites that have
the same readership
Visit multiple sites
with minimal
audience overlap
Slant
Information
source slant
Mean slant
Time-weighted average of
political slant for visits to
any of 177 news sites (-100
to 100 range; lower values
more liberal, higher values
more conservative)
Either all visits to
single most-centrist
site or visits to a
perfectly balanced
set of sites
All visits to either
the most liberal
news site or the
most conservative
news site
Diversity
and slant
Cross-cutting
content
consumption
Cross-cutting
proportion
Time-weighted percentage
of news sites visited with
political slant scores
opposite to a user’s base
ideology (0 to 100 range)
All news sites visits
in the same category
of political slant
A user spends a
significant amount
of time at news
sites opposing
their base ideology
able to conclude that the data represents a meaningful portion
of users’ news browsing and social media activity (possibly
even a significant majority given the period of data collec-
tion).
Measures and Analysis
To test our hypotheses, we estimated fixed effects within-
person models over a panel comprised of 4-week periods. For
each individual in our sample, we calculated measures per
nonoverlapping four-week period of their tenure (see Tables
3 and 4 for a summary of measures). To better understand
information source consumption, we focused on information
diversity and slant of news consumption among active users.
Limiting our analyses to user-periods containing at least one
news site visit resulted in an unbalanced panel of 185,548
individuals with a total of 1,096,480 user-period observations
for an average of 5.9 observations per individual in our
sample. Summary statistics and correlations are reported in
1630 MIS Quarterly Vol. 44 No. 4/December 2020

Kitchens et al./Echo Chambers and Filter Bubbles
the Appendix. In such a within-person model, the results may
be interpreted as estimated differences for an individual,
comparing periods when they use social media platforms more
to those periods in which that same individual uses them less.
This design avoids the potentially problematic comparison of
light and heavy platforms users to each other and helps to
isolate the impacts of changes in an individual’s platform use
from other characteristics of the user.
The independent variables relate to the use of three social
media platforms (Facebook, Twitter, and Reddit) that provide
links to news sites. We measured the number of visits to news
sites occurring via referrals from each platform to assess the
effect of these referrals on diversity and slant. Also, we mea-
sured the number of visits made directly to the home page of
a news site (for instance, by typing the URL of the news site
directly into the browser navigation bar). Because these
direct visits are made independent of exposure to platform-
prioritized information sources, they provide a baseline
against which to assess the impact of diversity and slant of
news site visits referred by social media platforms. Beyond
the primary effect of news site referrals, we also expected that
general usage of these platforms may influence news con-
sumption, and therefore also measured the time individuals
spent on each platform, as well as their total time online.
Finally, as a control for use of other popular information
discovery platforms, we include time and count variables for
individuals’ use of email and search.
Information Diversity
We adopted four distinct but complementary measures that
together provide a holistic view of information source diver-
sity of news site visits, as described in Table 4. First, the
number of distinct sites visited by each user during each a
period measures information source quantity. Next, we
measure slant dispersion as separation on the horizontal
dimension of partisan slant by calculating the time-weighted
standard deviation of the slant of news sites visited by a user
during a period (measurement of slant itself is detailed in the
next section). Intuitively, this represents the spread of a user’s
news consumption along the ideological continuum. Third,
we measure information source parity as the vertical distribu-
tion of news source consumption, calculated as the reverse-
coded Gini index of time spent by a user on each distinct news
site within a period.
2
If a user visits 10 diverse sites, but
spends 99% of their time on one of these, the level of diver
sity is still effectively low, which will be captured by this
measure.
Information source variety represents diversity across any
number of dimensions or categories. From the perspective of
news, this could be by a topic (politics, sports, celebrity),
presentation mode (short-form prose, long-form prose, info-
graphic, video), exposition (fact reporting, opinion, editorial),
etc. Instead of attempting to identify all possible underlying
factors of variety, we used the site visit history of all 3 million
panel members to estimate these latent factors that drive users
to visit different sites. The intuition behind this measure is
that sets of news sites with higher levels of audience variety—
that is, a lower overlap of actual audiences—are more likely
to provide diverse information. To calculate this measure, we
first defined a co-visitation network of all users to all news
sites. For each pair of news sites p and q, we calculated v
pq
,
the number of users who visited both sites, and defined an
intermediate measure of the audience overlap of these sites,
v
pq
/ min(v
p
, v
q
); note 0 # v
pq
/ min(v
p
, v
q
) # 1.
3
Time-weighted
audience variety is then calculated across all pairs of news
sites visited by user i in period t:
4
Partisan Shift
Hypotheses 2a and 2b concern the relationship between social
media use and change in the slant of information sources
consumed. For outcomes related to slant, we based the
measurement on slant scores for 177 commonly visited online
news sites published in Shore et al. (2018), as detailed in the
Appendix. We calculated the time-weighted average slant of
online news sites visited by a user during a given period. Our
scores are scaled from their range of ±3.602 to a range of
±100 for ease of exposition. Because a change in partisan
slant is relative to a referent base ideological position for each
user, we also categorized individuals as being in conservative,
centrist, or liberal terciles of our sample by calculating a time-
weighted average slant score per individual based on all of
their news sites visits while on the panel. We used a categori-
cal, rather than continuous, measure following prior research
that has shown qualitative differences between liberals and
conservatives (e.g., Bakshy et al. 2015; Bail et al. 2018).
2
The Gini index is a measure of concentration, so it must be reverse coded
to reflect increasing diversity.
3
The choice of min(v
p
, v
q
) prevents relatedness scores from being biased
downward when comparing sites with large discrepancy in visitation rates.
We also used the maximum and average of v
p
and v
q
with similar results.
4
We are fortunate to be able to calculate this measure due to the rich nature
of our data. Harrison and Klein (2007) suggest the Blau index as a more
generic measure of variety, which we also tested with results consistent with
the measures presented.
MIS Quarterly Vol. 44 No. 4/December 2020 1631

Kitchens et al./Echo Chambers and Filter Bubbles
Figure 3. Alternative Measures of Cross-Cutting Content (Illustrated for Liberal Users)
We acknowledge that assigning a single score to describe the
political slant of all content on a given news site is a simplifi-
cation. Any given article on a news site may express a
political ideology that is well-aligned or misaligned with the
perceived or actual ideology typical for that site. However,
we build on prior work showing that slant scores provide
insight into general user behaviors (Gentzkow and Shapiro
2011; Shore et al. 2018). Indeed, a survey conducted by Pew
Research Center of 12,043 adults concludes that “deep
partisan divisions exist in the news sources Americans trust,
distrust and rely on” (Jurkowitz et al. 2020, p. 4). Thus, when
users choose to consume information sources, the dominant
ideological position of the information source (in this case, a
news site) is a salient factor in their decision.
To further confirm the external validity of assigning slant
scores to online news sites, we surveyed 426 individuals
regarding their political affiliation and likelihood to read news
from a set of websites. Analysis of these survey responses
demonstrates a clear relationship between an individual’s
political affiliation and their likelihood to visit various news
sites. The correlation between the slant scores of news sites
and the coefficients of simple linear regressions of political
affiliation on the likelihood to visit them is 0.73. These
results (available upon request) suggest that individuals per-
ceive the site that hosts a news article as a strong signal of
potential alignment with their political affiliation.
Cross-Cutting Content Consumption
Finally, we calculated the percentage of cross-cutting content
consumed by each user. As discussed earlier, changes in this
measure reflect a change in both diversity and slant. Because
there is no generally accepted approach for identifying cross-
cutting content, we calculated the proportion of content in
three distinct ways as illustrated in Figure 3. These alterna-
tive measurements incorporate different thresholds for how
different an information source’s slant needs to be from a
user’s baseline position in order to be considered cross-
cutting. First, for users in conservative or liberal terciles, we
calculated the proportion of content they consumed that is in
the opposite tercile (i). Second, we calculated the proportion
of content users in these terciles consume that was at least
across the median (ii). Third, we calculated the proportion of
content users in these terciles consumed in the opposite or
centrist tercile (iii).
Results
Information Diversity
To test H1, we used fixed effects within-person models to
estimate the association between the use of popular social
media platforms and four measures of information diversity
(results shown in Tables 5 and 6). All models control for
direct news site visits and total time spent online, as well as all
time-invariant user characteristics removed via the fixed effect
within transformation. Because of the relatively large sample
size, as suggested by Lin et al. (2013) we report coefficient
confidence intervals for each of our models across a range of
subsample sizes in Appendix Figure A1. Additionally, we
present an intuitive analysis of effect sizes in the discussion
section.
For the first measure of information diversity, the number of
distinct news sites visited within a period (Table 5, Panel A),
we found that each referral from a social media platform to a
news site was associated with an increase in the number of
distinct news sites visited by an individual within the same 4-
week time period. By comparison, the estimated association
between the number of direct visits and total distinct news site
visits was very low. This result is consistent with the intuitive
understanding that, whereas direct site visits are more likely
to be return visits to a previous site, individuals are exposed
to additional information sources through their use of social
media. Nonetheless, we found significant variation among
platforms in the strength of the association between referrals
1632 MIS Quarterly Vol. 44 No. 4/December 2020

Kitchens et al./Echo Chambers and Filter Bubbles
Table 5: Association of Platform Use and Information Source Diversity: Quantity and Separation
Panel A: DV = Distinct News Sites Panel B: DV = Slant Dispersion
I II III IV I II III IV
Facebook referrals
0.268*** 0.261*** 0.299*** 0.260***
(0.0012) (0.0012) (0.0052) (0.0053)
Reddit referrals
0.884*** 0.767*** 0.354*** 0.196***
(0.0051) (0.0055) (0.0215) (0.0235)
Twitter referrals
0.506*** 0.476*** 0.014 -0.014
(0.0077) (0.0078) (0.0328) (0.0332)
Search referrals
0.418*** 0.407*** 0.377*** 0.343***
(0.0009) (0.0009) (0.0039) (0.0039)
Email referrals
0.086*** 0.085*** 0.039*** 0.035**
(0.0025) (0.0025) (0.0106) (0.0106)
Direct visits
0.018*** 0.012*** 0.018*** 0.012*** 0.001 -0.005*** 0.001 -0.004***
(0.0001) (0.0001) (0.0001) (0.0001) (0.0004) (0.0004) (0.0004) (0.0004)
Time on Facebook
(Log
2
of hours)
0.197*** 0.062*** 0.562*** 0.432***
(0.0033) (0.0029) (0.0123) (0.0124)
Time on Reddit
(Log
2
of hours)
1.803*** 0.804*** 1.418*** 1.090***
(0.0164) (0.0156) (0.0611) (0.0665)
Time on Twitter
(Log
2
of hours)
0.425*** 0.186*** 0.229*** 0.116**
(0.0110) (0.0097) (0.0410) (0.0414)
Time on search
(Log
2
of hours)
0.572*** 0.240*** 0.988*** 0.707***
(0.0047) (0.0042) (0.0177) (0.0178)
Time on email
(Log
2
of hours)
-0.135*** -0.062*** -0.209*** -0.143***
(0.0046) (0.0040) (0.0171) (0.0171)
Total time online
(Log
2
of hours)
0.614*** 0.418*** 0.289*** 0.297*** 1.301*** 1.126*** 0.680*** 0.688***
(0.0024) (0.0021) (0.0032) (0.0028) (0.0089) (0.0089) (0.0119) (0.0119)
Intercept
-0.019 0.318*** 0.373*** 0.459*** 0.325*** 0.620*** 1.062*** 1.130***
(0.0118) (0.0101) (0.0119) (0.0103) (0.0432) (0.0429) (0.0443) (0.0440)
Observations 1,096,480 1,096,480 1,096,480 1,096,480 1,096,480 1,096,480 1,096,480 1,096,480
Individuals 185,548 185,548 185,548 185,548 185,548 185,548 185,548 185,548
R-squared 0.0920 0.3349 0.1273 0.3404 0.0231 0.0384 0.0306 0.0423
Standard errors shown in parenthesis below estimated coefficients.
*p < 0.05, **p < 0.01, ***p < 0.001
and distinct news sites. For example, for every 10 Reddit
referrals there are almost 8 distinct news sites visited during
the period, whereas 10 Facebook referrals relates to less than
3 new distinct news sites visited.
We also found that time spent on each platform was signi-
ficantly and positively associated with the number of distinct
news sites visited, with relative estimated effect sizes among
platforms substantially similar to that of referrals. The sole
exception was time spent on email, which was associated with
a slight reduction in the number of distinct news sites visited.
Because time variables are base-2 logged, their coefficients
represent the effect of a doubling of time spent on each
platform. A user doubling their typical amount of time spent
using Reddit visited 0.8 additional distinct sites in a period,
while a user doubling time on Facebook visited only 0.06
additional distinct sites.
We report the results for slant dispersion in Panel B of Table
5. Among social media platforms, we found that the use of
Reddit was associated with the most substantial magnitude
increases in slant dispersion, particularly for time spent on
each platform. Facebook referrals and time on Facebook
both had moderate positive associations with slant dispersion.
MIS Quarterly Vol. 44 No. 4/December 2020 1633

Kitchens et al./Echo Chambers and Filter Bubbles
Table 6. Association of Platform Use and Information Source Diversity: Variety and Parity
Panel C: DV = Audience Variety Panel D: DV = Reverse Gini Idex
I II III IV I II III IV
Facebook referrals
0.700*** 0.557*** 0.887*** 0.823***
(0.0200) (0.0203) (0.0104) (0.0105)
Reddit referrals
0.699*** 0.098 0.824*** 0.425***
(0.0822) (0.0897) (0.0426) (0.0465)
Twitter referrals
-0.231 -0.368** 0.373*** 0.259***
(0.1251) (0.1266) (0.0648) (0.0656)
Search referrals
1.758*** 1.591*** 1.432*** 1.355***
(0.0148) (0.0150) (0.0077) (0.0078)
Email referrals
0.144*** 0.138*** 0.518*** 0.513***
(0.0405) (0.0405) (0.0209) (0.0210)
Direct visits
0.016*** -0.005** 0.015*** -0.003 0.059*** 0.039*** 0.058*** 0.040***
(0.0017) (0.0017) (0.0017) (0.0017) (0.0009) (0.0009) (0.0009) (0.0009)
Time on Facebook
(Log
2
of hours)
1.861*** 1.524*** 1.093*** 0.664***
(0.0469) (0.0473) (0.0247) (0.0245)
Time on Reddit
(Log
2
of hours)
4.572*** 4.108*** 3.587*** 2.730***
(0.2334) (0.2538) (0.1228) (0.1315)
Time on Twitter
(Log
2
of hours)
1.055*** 0.643*** 1.160*** 0.654***
(0.1566) (0.1579) (0.0824) (0.0818)
Time on search
(Log
2
of hours)
5.021*** 3.758*** 2.813*** 1.716***
(0.0675) (0.0680) (0.0355) (0.0352)
Time on email
(Log
2
of hours)
-1.438*** -1.110*** -0.693*** -0.474***
(0.0654) (0.0653) (0.0344) (0.0338)
Total time online
(Log
2
of hours)
7.761*** 7.072*** 5.152*** 5.161*** 4.781*** 4.145*** 3.233*** 3.256***
(0.0340) (0.0342) (0.0456) (0.0453) (0.0179) (0.0177) (0.0240) (0.0235)
Intercept
5.869*** 6.981*** 8.859*** 9.119*** -3.339*** -2.273*** -1.519*** -1.260***
(0.1650) (0.1639) (0.1691) (0.1680) (0.0869) (0.0848) (0.0890) (0.0870)
Observations 1,096,480 1,096,480 1,096,480 1,096,480 1,096,480 1,096,480 1,096,480 1,096,480
Individuals 185,548 185,548 185,548 185,548 185,548 185,548 185,548 185,548
R-squared 0.0549 0.0718 0.0640 0.0769 0.0797 0.1264 0.0909 0.1304
Standard errors shown in parenthesis below estimated coefficients.
*p < 0.05, **p < 0.01, ***p < 0.001
Finally, Twitter use was associated with minimal change in
slant dispersion. In comparing the analyses for distinct site
visits (Panel A) and slant dispersion (Panel B), the R
2
for the
latter is lower than the former. Nonetheless, there is nearly a
doubling in R
2
from Panel B Model I including only direct
visits and total time online to Panel B Model IV also
including social media usage. In all, we conclude that the
relationships between slant dispersion and the use of Reddit
and Facebook are modest but nontrivial.
Panels C and D in Table 6 provide results for the information
source diversity measures of audience variety and reverse
Gini index, respectively. Among the social media platforms,
we found again that the use of Reddit was associated with the
most substantial magnitude increase in both measures, fol-
lowed by Facebook. Similarly, Twitter was associated with
minimal changes. In summary, in considering all four diver-
sity measures, we conclude that for Facebook and Reddit
there is consistent support of hypothesis H1b, predicting a
1634 MIS Quarterly Vol. 44 No. 4/December 2020

Kitchens et al./Echo Chambers and Filter Bubbles
broadening association between platform use and information
source consumption. For these platforms, there is no support
of the alternative H1a. With inconsistent sign and signifi-
cance as well as lower magnitude of observed effects
associated with Twitter usage, we find weak, mixed support
for either H1a (narrowing) and for H1b (broadening).
Partisan Shift
To measure shifts in the slant of news consumed, we divided
users into conservative, centrist, and liberal terciles and used
a fixed effects within-person model to estimate the relative
mean slant of news consumed by these users during periods of
higher or lower usage of each social media platform.
5
Each
variable is interacted with a tercile indicator variable, with the
main effect of the tercile indicator subsumed by the fixed
effect. This effectively allows separate models for each
tercile to be estimated simultaneously within one model. With
slant scores ranging from negative (indicating liberal) to
positive (indicating conservative), a positive coefficient for
users in the conservative tercile indicates a partisan shift (i.e.,
a shift from conservative to more conservative), whereas a
negative coefficient indicates a moderating shift. The oppo-
site signs apply for the liberal tercile.
As shown in Table 7, an increase in referrals from and time
spent using Facebook were associated with a partisan shift in
the slant of news consumed. In periods when conservative
individuals used Facebook more, their news site visits were
more conservative. The same applies to liberal users, but with
lower magnitude. For Reddit, increased referrals were asso-
ciated with a moderating shift for conservative users, yet there
was no association found for liberal users. Twitter usage had
no significant association with changes in slant. Overall,
these results support H2a for Facebook, where greater use was
associated with a partisan shift in information source con-
sumption. The results support H2b for Reddit, with greater
use associated with a moderating shift, albeit for conservative
users only. However, R
2
values are very low, meaning that
the vast majority of variance in the mean slant of information
sources consumed by users remains unexplained by their
social media usage.
Cross-Cutting
As a final analysis, we estimated the relationship between
social media use and the percentage of cross-cutting content
consumption using three classifications for cross-cutting
content. The three panels in Table 8 (F, G, and H) correspond
with the classifications of cross-cutting illustrated in Figure 3
as alternatives (i), (ii), and (iii), respectively. The results are
largely consistent for all three measurement approaches.
6
In
all three cases, Facebook referrals were associated with a
decrease in the percentage of cross-cutting content consumed
by users. However, as highlighted by a shaded band in
Table 8, for time spent on Facebook, results vary depending
upon what threshold is applied to define cross-cutting.
Results ranged from significantly positive for the most strin-
gent categorization (i.e., cross-cutting news is only news from
the opposite side) to significantly negative for the least strin-
gent categorization (i.e., cross-cutting news also includes a
large segment of centrist content). We find little to no evi-
dence for an association of Reddit or Twitter with cross-
cutting.
It is also interesting to note that, although cross-cutting con-
sumption conflates both diversity and slant, the estimated
effects for cross-cutting were more closely aligned with esti-
mated effects for shifts in slant, particularly for Facebook and
the reference platforms of search and email. The R
2
values
were also very low, which more closely resembles those for
shifts in slant. This stands in contrast to prior research that
considers cross-cutting consumption as a measure of diversity
(e.g., Bakshy et al. 2015). Our findings support the conclu-
sion that a holistic view encompassing separate dimensions of
information source diversity and slant provides a more com-
plete and nuanced understanding of information consumption
than considering cross-cutting content consumption alone.
Discussion
Summary of Findings
In summary, we found that the use of different social media
platforms had varying associations with changes in infor-
mation consumption. Tables 9 and 10 summarize estimated
referral and time coefficients across platforms for each
dependent variable. These coefficients were drawn from the
fully specified Model IV of each panel and are shaded by
magnitude. For comparison we also included the results for
search and email. Use of Facebook and Reddit were each
associated with increases in information source diversity
across all measures, with the estimated effects of Reddit
significantly larger than those of Facebook. Use of Twitter
5
We tested a variety of divisions, including median split, quartiles, quintiles,
sextiles, and deciles, with varying sizes for the centrist component, finding
results consistent across a wide range of measurement choices.
6
We also calculated these measures with alternatives that varied both the size
of the partisan groups as well as the categorization of cross-cutting content.
Those results are consistent with variations reported here.
MIS Quarterly Vol. 44 No. 4/December 2020 1635

Kitchens et al./Echo Chambers and Filter Bubbles
Table 7. Association of Platform Use and Mean Slant
Panel E: DV = Mean Slant
Measure Tercile I II III IV
Facebook referrals
Liberal -0.078*** -0.069***
Centrist -0.053* -0.033
Conservative 0.396*** 0.384***
Reddit referrals
Liberal -0.002 -0.019
Centrist -0.242** -0.130
Conservative -0.784*** -0.599**
Twitter referrals
Liberal -0.055 -0.073
Centrist -0.162 -0.110
Conservative -0.132 -0.116
Search referrals
Liberal 0.195*** 0.184***
Centrist 0.074*** 0.076***
Conservative -0.273*** -0.261***
Email referrals
Liberal -0.066* -0.064*
Centrist -0.032 -0.033
Conservative 0.425*** 0.423***
Direct visits
Liberal -0.002 -0.005 -0.002 -0.005
Centrist 0.007** 0.006** 0.007** 0.006**
Conservative 0.016*** 0.015*** 0.016*** 0.016***
Time on Facebook
(Log
2
Hours)
Liberal -0.160*** -0.137**
Centrist -0.161*** -0.158***
Conservative 0.360*** 0.207***
Time on Reddit
(Log
2
Hours)
Liberal 0.114 0.121
Centrist -0.847*** -0.713**
Conservative -1.275*** -0.731
Time on Twitter
(Log
2
Hours)
Liberal 0.142 0.121
Centrist -0.231* -0.235*
Conservative -0.217 -0.170
Time on search
(Log
2
Hours)
Liberal 0.388*** 0.269***
Centrist 0.080 0.022
Conservative -0.617*** -0.416***
Time on email
(Log
2
Hours)
Liberal -0.188** -0.144*
Centrist -0.042 -0.022
Conservative 0.394*** 0.247***
Time online
(Log
2
Hours)
Liberal 0.131*** 0.094** 0.08 0.074
Centrist 0.010 -0.006 0.065 0.063
Conservative -0.188*** -0.183*** -0.175*** -0.156***
Intercept Intercept -4.315*** -4.289*** -4.325*** -4.325***
Observations 1,096,480 1,096,480 1,096,480 1,096,480
R-squared 0.0004 0.0020 0.0007 0.0021
Number of individuals 185,548 185,548 185,548 185,548
Standard errors omitted for space and can be provided upon request.
*p < 0.05, **p < 0.01, ***p < 0.001
1636 MIS Quarterly Vol. 44 No. 4/December 2020
Kitchens et al./Echo Chambers and Filter Bubbles
Table 8. Association of Platform Use and Consumption of Cross-Cutting News
Panel F: DV = Cross-Cutting (user tercile
to opposite news site tercile)
Panel G: DV = Cross-Cutting (user tercile
to opposite news site half)
Panel H: DV = Cross-Cutting (user tercile
to centrist or opposite news site tercile)
I II III IV I II III IV I II III IV
Facebook
referrals
-0.083*** -0.099*** -0.203*** -0.205*** -0.362*** -0.339***
(0.0121) (0.0123) (0.0161) (0.0163) (0.0170) (0.0173)
Reddit
referrals
0.036 0.012 0.062 0.047 0.144* 0.092
(0.0497) (0.0544) (0.0659) (0.0722) (0.0699) (0.0765)
Twitter
referrals
-0.049 -0.037 -0.010 -0.001 0.009 -0.008
(0.0756) (0.0767) (0.1003) (0.1018) (0.1064) (0.1080)
Search
referrals
0.104*** 0.096*** 0.177*** 0.167*** 0.251*** 0.240***
(0.0090) (0.0091) (0.0119) (0.0121) (0.0126) (0.0128)
Email
referrals
-0.119*** -0.115*** -0.139*** -0.134*** -0.180*** -0.179***
(0.0245) (0.0246) (0.0324) (0.0326) (0.0344) (0.0345)
Direct visits
-0.012*** -0.013*** -0.012*** -0.013*** -0.015*** -0.016*** -0.015*** -0.016*** -0.017*** -0.017*** -0.017*** -0.017***
(0.0010) (0.0010) (0.0010) (0.0010) (0.0013) (0.0014) (0.0013) (0.0014) (0.0014) (0.0014) (0.0014) (0.0014)
Time on
Facebook
0.166*** 0.199*** -0.064 0.008 -0.453*** -0.331***
(0.0283) (0.0288) (0.0376) (0.0381) (0.0398) (0.0405)
Time on
Reddit
0.178 0.168 0.141 0.098 0.424* 0.342
(0.1406) (0.1539) (0.1865) (0.2042) (0.1979) (0.2166)
Time on
Twitter
-0.098 -0.109 -0.041 -0.072 0.170 0.129
(0.0944) (0.0959) (0.1252) (0.1272) (0.1329) (0.1349)
Time on
search
0.253*** 0.184*** 0.390*** 0.272*** 0.531*** 0.364***
(0.0407) (0.0413) (0.0540) (0.0548) (0.0573) (0.0581)
Time on
email
-0.150*** -0.111** -0.257*** -0.196*** -0.295*** -0.208***
(0.0394) (0.0396) (0.0523) (0.0526) (0.0555) (0.0558)
Time online
0.369*** 0.353*** 0.239*** 0.234*** 0.201*** 0.182*** 0.134*** 0.124*** -0.076** -0.093** -0.050 -0.066
(0.0204) (0.0207) (0.0275) (0.0275) (0.0271) (0.0275) (0.0365) (0.0365) (0.0287) (0.0291) (0.0387) (0.0387)
Intercept
6.873*** 6.886*** 7.010*** 7.014*** 15.750*** 15.758*** 15.787*** 15.794*** 29.713*** 29.704*** 29.623*** 29.631***
(0.0992) (0.0994) (0.1022) (0.1022) (0.1316) (0.1318) (0.1355) (0.1355) (0.1396) (0.1398) (0.1438) (0.1437)
Observations 1,092,010 1,092,010 1,092,010 1,092,010 1,092,010 1,092,010 1,092,010 1,092,010 1,092,010 1,092,010 1,092,010 1,092,010
Number of
Individuals
185,282 185,282 185,282 185,282 185,282 185,282 185,282 185,282 185,282 185,282 185,282 185,282
R-squared 0.0005 0.0007 0.0006 0.0008 0.0002 0.0006 0.0003 0.0006 0.0002 0.0011 0.0004 0.0012
Standard errors shown in parenthesis below estimated coefficients.
*p < 0.05, **p < 0.01, ***p < 0.001
MIS Quarterly Vol. 44 No. 4/December 2020 1637

Kitchens et al./Echo Chambers and Filter Bubbles
Table 9. Summary of Estimated Coefficients for Changes in Information Source Diversity
Distinct News Sites Slant Dispersion Audience Variety Gini Index
Hyp.
SupportReferrals Time Referrals Time Referrals Time Referrals Time
Facebook 0.261 0.062 0.260 0.432 0.557 1.524 0.823 0.664 H1a
Reddit 0.767 0.804 0.196 1.090 4.108 0.425 2.73 H1a
Twitter 0.476 0.186 0.116 -0.368 0.643 0.259 0.654 Mixed/low
Search 0.407 0.240 0.343 0.707 1.591 3.758 1.355 1.716
Email 0.085 -0.062 0.035 -0.143 0.138 -1.110 0.513 -0.474
Darker shading represents increasing absolute magnitude of coefficients within DV (coefficients with p > 0.05 omitted).
Green cells with black text are positive estimated coefficients, and orange cells with white text negative.
Table 10. Summary of Estimated Coefficients for Changes in Information Source Slant
Liberal Tercile Centrist Tercile Conservative Tercile Hyp.
Support
Referrals Time Referrals Time Referrals Time
Facebook -0.069 -0.137 -0.158 0.384 0.207 H2a
Reddit -0.713 -0.599 H2b (cons)
Twitter -0.235 None
Search 0.184 0.269 0.076 -0.261 -0.416
Email -0.064 -0.144 0.423 0.247
Darker shading represents increasing absolute magnitude of coefficients (coefficients with p > 0.05 omitted).
Blue cells with white text are negative estimated coefficients (more liberal), red cells with black text are positive (more conservative).
had mixed associations with diversity with low magnitudes.
Use of Facebook was associated with partisan shifts in slant,
notably larger for conservatives than for liberals. Conversely,
use of Reddit was associated with moderating shifts in slant
for conservatives.
The R
2
values for partisan shift and cross-cutting models (all
less than 1%) were much lower than those for diversity
(ranging from 4% to 34%). Thus, while social media
platforms are associated with changes in each of these
measures, there is much less unexplained variation in diversity
after accounting for platform use. This further underscores
the need to isolate and separately study the underlying
dimensions of information-limiting environments.
To demonstrate the magnitude of effects, we calculated
example estimated effects by platform for a concurrent
increase in both referrals and time. These measures of use
were jointly estimated, and it is intuitive to imagine that
increased referral activity from a platform corresponded with
increased time on the platform, and vice versa. Figure 4
demonstrates the marginal change in information diversity and
slant associated with a user who clicked on an additional six
referrals to news sites from a platform and had a four-fold
increase in time spent on the platform (e.g., an increase from
1 hour to 4 hours). Our measures are calculated per
individual by month, so this may be interpreted as a com-
parison of a month when a user had significant use of a
platform to a month when that user had limited use of that
platform. In a period when an average user has this type of
increase on Facebook (6 more referrals and 4times more time
spent), their standard deviation of slant would be 37% higher,
moving from 6.5 to 9.0. If conservative, their mean slant
would have increased by 2.7; if liberal, it would have
decreased by 0.7.
To illustrate these effects in combination, we provide an
example in Figure 5 for a representative conservative user
with monthly news site visits that have a mean slant of 10 and
standard deviation of 6.5. For this user, a ±2 standard devia-
tion range of online news consumption (e.g., -3 to 23) encom-
passes both USA Today (-0.4) and the New York Post (21.5).
In a month with 6 additional news referrals from and 4 times
more time spent on Facebook than average, their consumption
would shift to a more conservative mean, but also broaden.
Their estimated range of ±2 standard deviations (-4.6 to 31.2)
would increase by encompassing some additional news
sources to the left, but even more to the right (almost
including Fox News). If not for the rightward, partisan shift
in mean, the increase in diversity alone would have resulted
in a range of -7.9 to 27.9 (thereby including CNN to the left).
A similar example is also shown in Figure 5 for the combina-
1638 MIS Quarterly Vol. 44 No. 4/December 2020
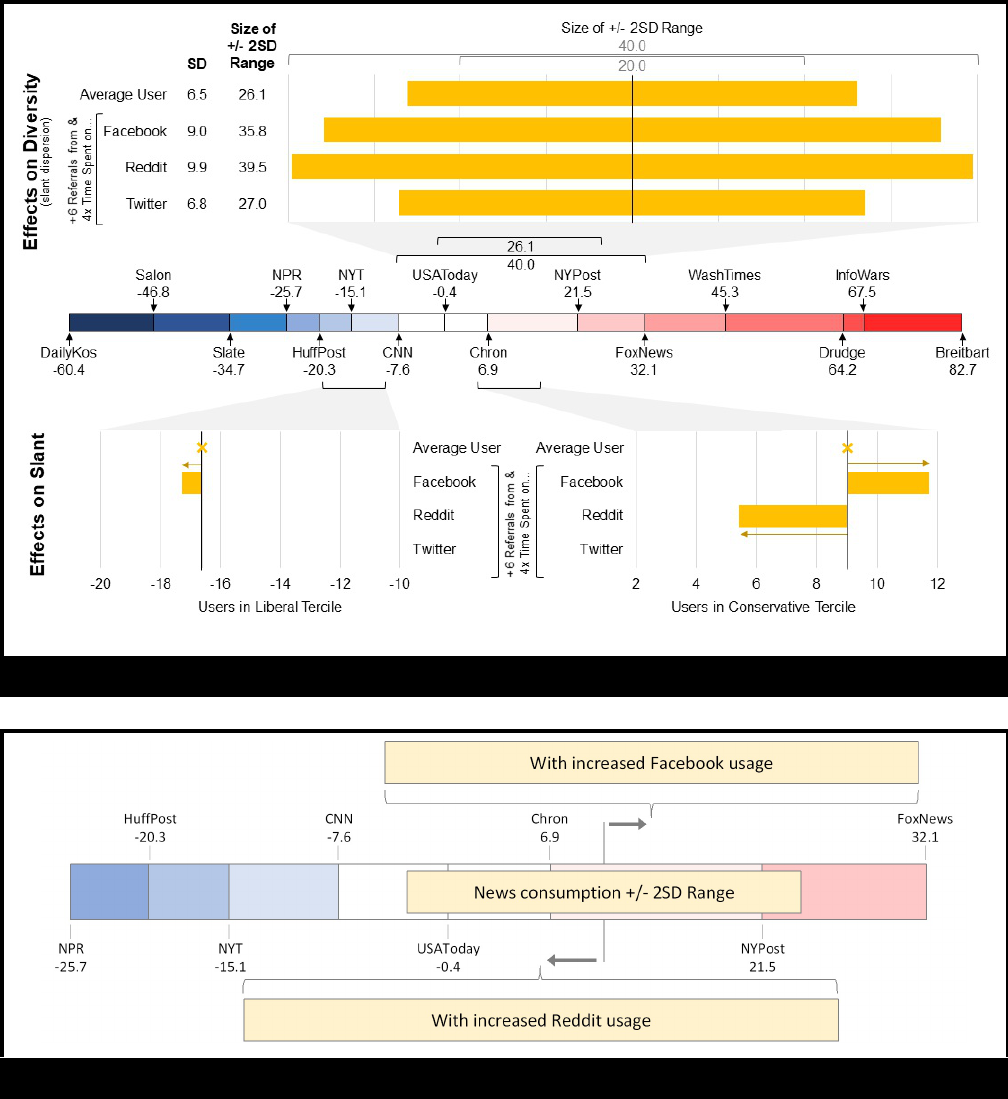
Kitchens et al./Echo Chambers and Filter Bubbles
Figure 4. Social Media Platform Use, Diversification, and Partisan Shift
Figure 5. Effects of Increased Platform Use for a Representative Conservative User
MIS Quarterly Vol. 44 No. 4/December 2020 1639
Kitchens et al./Echo Chambers and Filter Bubbles
tion of broadening diversity with a moderating shift associated
with an increased use of Reddit. These stylized examples
demonstrate that associations with diversity and slant differ in
important ways by platform.
Implications for Conceptualizing Echo
Chambers and Filter Bubbles
We identify five contributions that this study makes to the
conceptualization of echo chambers and filter bubbles. First,
we adopt a generative framing of information-limiting envi-
ronments as reflecting concerns raised in discussion of these
captivating, yet elusive, phenomena. By considering more
nuanced ways that social media usage may shape information
consumption, we highlight both the hopes and fears for online
technology. On one hand, there is a widespread fear that
homophily and algorithmic filtering will amplify personal
preference for congenial, ideologically congruent content and
foster information-limiting environments that exclude
opinion-challenging information (Pariser 2011; Sunstein
2017). On the other, there is the hopeful potential for social
media and other information discovery platforms to expand
individuals’ information consumption by connecting them
with a broad range of relevant information sources. To ap-
propriately address this tension, we move beyond a limiting,
muddled question of whether information-limiting environ-
ments exist to a more generative framing of how platforms
influence information source consumption.
Second, by examining in detail the constituent elements of
diversity and slant of information consumption we provide a
deeper understanding of the phenomenon. There is a long-
standing interest in understanding preferences for opinion-
challenging versus opinion-confirming information (see Hart
et al. 2009). This interest has often informed the under-
standing of filter bubbles and echo chambers as being
manifest in a binary outcome: the presence or absence of
cross-cutting content consumption (Bakshy et al. 2015; Mutz
and Martin 2001). The joint consideration of diversity and
slant provides a richer depiction of the variety of ways that
platforms may help shape exposure, engagement, and con-
sumption of information sources. Indeed, empirically we find
a range of outcomes across both dimensions.
Third, we demonstrate the value of conceptualizing the
relationship between platform use and information source
consumption at an individual-level, using panel data to
identify within-user effects. Prior research has often focused
on ideological segregation at a population-level by comparing
the distribution of information source consumption among
categories of users (Gentzkow and Shapiro 2011). For
example, conservative and liberal platform users prefer dif-
ferent online news sources (Flaxman et al. 2016; Jacobson et
al. 2016). However, a cross-sectional observation of aggre-
gated user preferences is insufficient to fully address how
platform usage shapes consumption. Relationships observed
at a group level do not necessarily hold for individuals within
the same groups (Freedman 1999); thus, individual-level
effects are best understood by analyzing individual-level data.
Our inquiry complements studies that focused on individual-
level outcomes associated with usage of Facebook (Bakshy et
al. 2015) and Twitter (Shore et al. 2018). We extend this
prior work further by concurrently analyzing individual-level
usage across multiple social media platforms. By considering
variation in platform use and information source consumption
for the same individual, we provide a more nuanced expli-
cation of the differential effects of various platforms.
Fourth, incorporating a multifaceted view of diversity
(Harrison and Klein 2007) provides additional insights into
information source consumption. Social media platforms are
important pathways for individuals to discover new sources of
information, and ideological differences are just one form of
differentiation among information sources. In defining infor-
mation source diversity in terms of separation, variety, and
disparity among information sources, we extend prior work
that focused on dominant ideological stance of an information
source as a source of information diversity (Shore et al. 2018).
The consistency of our results suggests there are additional
ways to reliably conceptualize and measure information
source diversity beyond political ideology, which may be
particularly useful for studying contexts where dominant
ideology of an information source is not evident or relevant.
Finally, our conceptual model illustrates the importance of
considering how the underlying characteristics of platforms
may each uniquely shape information consumption. Our
differentiation of usage by platform expands on prior work
that considered multiple platforms together, such as the com-
bination of email plus multiple social media platforms as a
single technology category by Flaxman et al. (2016). We find
wide variation in outcomes among the platforms that Flaxman
et al. aggregated together, thereby demonstrating the value of
considering them individually. By analyzing patterns of
results across different platforms, we can make inferences
about the impacts of individual features and mechanisms.
Next, we present possibilities following this line of thought.
Implications of Mechanisms for
Determining Information Sources
The variation of results by platform provides some suggestive
evidence about the most salient factors shaping information
source consumption. In comparing observed outcomes by
1640 MIS Quarterly Vol. 44 No. 4/December 2020

Kitchens et al./Echo Chambers and Filter Bubbles
Compared to
Direct Visits
Moderating
Shift
No
Change
Partisan
Shift
Narrowing
Diversity
No Change in
Diversity
Twitter
Email
Broadening
Diversity
Search Reddit
Facebook
Figure 6. Platform Use, Diversification, and Partisan Shift
platform (summarized in Figure 6) with how these platforms
prioritize the content provided to users (identified in Figure 2
and Table 2), we draw four broad inferences on the relative
importance of social network homophily and various
approaches to algorithmic filtering.
First, our findings provide insight about the potential role of
social influence in partisan shifts. On Facebook, as well as
the reference platform of email, the information sources a user
is exposed to are strongly influenced by other individuals with
whom the user has a strong sense of social identification and
affiliation (e.g., friends, family, and coworkers). In contrast,
social affiliation is somewhat less salient on Twitter (where
users form nonreciprocal relationships) and Reddit (where
content is largely organized in topic-based communities).
From this lens, a partisan shift is consistent with concerns that
platforms may reinforce social influence within heterogenous
social groups, and, thereby cause a hardening of partisan
beliefs (Sunstein 2002, 2009). In addition, Facebook and
email also both utilize some form of engagement-based
curation—Facebook’s curated news feed and email’s prior-
itized inbox—that could also contribute to a partisan shift
(Pariser 2011).
7
Second, for Reddit, as well as the reference platform of
search, algorithmic filtering is more heavily influenced by an
individual’s topics of interest than by their social network or
prior engagement with content. A broadening effect here is
consistent with prior work arguing that, in the course of inter-
actions on other topics, individuals experience an incidental
exposure to additional sources of news and information
(Fletcher and Nielsen 2018a; Weeks et al. 2017).
Third, our results highlight trade-offs inherent in the study of
information source consumption. By isolating within-person
variation over time in both platform use and news site con-
sumption, we are able to quantify variation among multiple
social media platforms and draw inferences about the impact
of platform characteristics in relation to consumption
behaviors. Yet, our ability to draw inferences about indi-
vidual characteristics and attitudes is limited. For example,
we are unable to assess the impact of selective exposure due
to individual preference for opinion-confirming content
(Festinger 1964; Hart et al. 2009). Further, the relatively
small amount of variation in partisan shifts explained by
platform usage in our analyses suggests there are significant
unobserved factors that shape consumption. Because no
single study can capture all of the factors that influence con-
sumption decisions, particularly when considering multiple
platform use by heterogeneous individuals, it is important to
further develop the conceptualization of information-limiting
environments in ways that can drive future empirical research,
as well as help integrate and reconcile findings.
Finally, the variation in our results across platforms implies
that rather than making broad-brush assertions about how they
may be information-limiting or information-expanding, more
focused attention should be paid to the range of individual
factors that determine how and to what extent platforms may
shape users’ choices. Further, our findings represent average
effects for a typical platform user, not a universal outcome for
all users. Platforms themselves are not monolithic; there may
be wide variation in how people use each platform as well as
changes in platform implementations over time. For example,
the impact of using interest-oriented features such as Face-
book pages (Jacobson et al. 2016; Skjerdal and Gebru 2020)
may differ from using only the primary Facebook news feed.
Thus, future research should take into account not only dif-
ferences across platforms but also differences among users in
how they use those platforms.
7
As noted, Twitter only implemented engagement-based feed curation in
2016, after our data collection.
MIS Quarterly Vol. 44 No. 4/December 2020 1641

Kitchens et al./Echo Chambers and Filter Bubbles
Practical Implications
Our findings have implications for a practical understanding
of information consumption. We find no support for a
prevalence of the popular, intuitive understanding of echo
chambers and filter bubbles. Specifically, we find no evi-
dence that the use of social media is limiting the information
sources that users choose to consume—instead, with respect
to information diversity we find a range of outcomes from
effectively neutral (no change) to positive (broadening
diversity). Nonetheless, we do find important variation
between platforms whose use was associated with moderating
shifts (Reddit) or partisan shifts (Facebook).
Of the platforms we consider, Facebook represents the most
complete embodiment of features that may impact users’ news
consumption choices. It hosts user-generated content, sug-
gests additions to users’ social networks, and provides several
content engagement options that influence the algorithmic
curation of information. Given the high level of personali-
zation that Facebook deploys in determining what content to
expose users to, we reiterate calls for further study of
Facebook’s algorithmic filtering (Sunstein 2017; Vaidhyana-
than 2018). Likewise, more research is needed to understand
the impacts of Twitter’s recent implementation of more
comprehensive algorithmic filtering. Yet, the study of these
features is stymied by a lack of transparency of platform
operations. As platform providers are unlikely to unilaterally
provide outside researchers with sufficient data on the imple-
mentation and effects of algorithmic filtering, there is an
important role for public policy oversight of these influential
platforms.
Limitations and Future Research
We acknowledge that our study has multiple limitations
related to the scope of the conceptual model, the scope of the
empirical test, and the research method. First, our conceptual
model focuses on individual and platform characteristics that
explain variation between platforms. There are additional
characteristics, including level of interest in politics (Dubois
and Blank 2018; Lawrence et al. 2010), reaction to content
topics (Baldassarri and Bearman 2007), and intensity of
platform use (Shore et al. 2018), that may help explain varia-
tion among individual users of the same platform. Also, our
scope is limited with regard to platform characteristics. Tech-
nology providers frequently update algorithms to determine
the most engaging and relevant information sources and
content to present to users; more research is needed to
encompass the full range of characteristics that influence this
presentation (Johnson et al. 2019). Likewise, our hypotheses
are focused on information source consumption. More
research is also needed to understand the antecedents and
consequences of exposure, engagement, and consumption.
For example, there is considerable research on opinion
formation that could be expanded upon to examine how usage
of social media relates to changes in opinions.
Second, the scope of empirical tests of our model is con-
strained by available data. The majority of the pathways in
our conceptual model are only observable at scale by platform
providers. For example, we could not observe the information
sources an individual was exposed to or engaged with on a
platform, nor other characteristics of those information
sources and their presentation. More research is needed to
better understand how exposure and engagement relate to the
information sources an individual chooses to consume.
Likewise, we were unable to observe how individuals varied
in their social networks and topic interests. Although the
within-person research design strengthens the robustness of
our results, these individual characteristics may change over
time and may even be shaped by platform usage. For these
reasons and others, it is impossible to establish causality
within our research design. The associations we identify are
informative of the variation among platforms and illustrative
of the importance of nuance in measurement. But more
research is required to establish causal effects and establish
the mechanisms that influence these outcomes.
Third, there are numerous limitations related to our data
source and measurements. Our sample only included adults
residing in the United States and may not be representative of
other populations. Another data limitation is that we only
observed desktop use of information discovery platforms and
online news sites. As discussed, we believe this still repre-
sents an important portion of user activity, but particularly as
mobile usage continues to replaces desktop use, additional
research is needed regarding how behavior on mobile devices
may differ. Another key operationalization in our study
involved attributing a slant score to all content on a single
news site domain. While we established that the news domain
provides a meaningful signal to the user, this is ultimately a
simplification of the potential information value of that con-
tent. Further, our measures of ideological diversity and news
source slant are most relevant in high media choice environ-
ments with a dominant liberal, centrist, and conservative
ideological configuration of public opinion; they may not
generalize to other settings.
Conclusion
The question of how social media platforms shape the con-
sumption of information and may foster the creation of
1642 MIS Quarterly Vol. 44 No. 4/December 2020
Kitchens et al./Echo Chambers and Filter Bubbles
information-limiting environments is crucial to society. Our
study provides a deeper conceptualization of this phenom-
enon, supported by insights obtained through observation of
user behaviors across various platforms in a natural environ-
ment, interacting with their naturally occurring social network,
without artificial intervention by researchers. As implied by
the complex variety in social media platforms, we found
considerable variation in observed impacts among them,
which helps explain prior conflicting conclusions, but also
leads to new unanswered questions. Based on our concep-
tualization and findings, we see a strong need for future
research to focus on the nuance of how the details of platform
implementations and individual choices combine to influence
a variety of outcomes that underlie the concerns that have
been raised in the discussion of echo chambers and filter
bubbles.
Acknowledgments
The authors would like to thank the McIntire School of Commerce
Foundation and the McIntire School of Commerce’s Center for
Business Analytics for their support as well as participants of the
Virginia Research Seminar Series and the UMD Center for the
Advanced Study of Communities and Information for their valuable
feedback. The authors would also like to thank the senior editor,
associate editor, and reviewers for their extremely helpful comments
and suggestions that greatly improved the quality of this work.
References
Adamic, L. A., and Glance, N. 2005. “The Political Blogosphere
and the 2004 U.S. Election: Divided They Blog,” in Proceedings
of the 3
rd
International Workshop on Link Discovery, New York:
ACM, pp. 36-43.
Allcott, H., and Gentzkow, M. 2017. “Social Media and Fake News
in the 2016 Election,” Journal of Economic Perspectives (31:2),
pp. 211-236.
Bail, C. A., Argyle, L. P., Brown, T. W., Bumpus, J. P., Chen, H.,
Hunzaker, M. F., Lee, J., Mann, M., Merhout, F., and
Volfovsky, A. 2018. “Exposure to Opposing Views on Social
Media Can Increase Political Polarization,” Proceedings of the
National Academy of Sciences (115:37), pp. 9216-9221.
Bakos, J. Y. 1997. “Reducing Buyer Search Costs: Implications
for Electronic Marketplaces,” Management Science (43:12), pp.
1676-1692.
Bakshy, E., Messing, S., and Adamic, L. A. 2015. “Exposure to
Ideologically Diverse News and Opinion on Facebook,” Science
(348:6239), pp. 1130-1132.
Baldassarri, D., and Bearman, P. 2007. “Dynamics of Political
Polarization,” American Sociological Review (72:5), pp.
784-811.
Barberá, P. 2015. “Birds of the Same Feather Tweet Together:
Bayesian Ideal Point Estimation Using Twitter Data,” Political
Analysis (23:1), pp. 76-91.
Boxell, L., Gentzkow, M., and Shapiro, J. M. 2017. “Greater
Internet Use Is Not Associated with Faster Growth in Political
Polarization among US Demographic Groups,” Proceedings of
the National Academy of Sciences (114:40), pp. 10612-10617.
Bozdag, E., and van den Hoven, J. 2015. “Breaking the Filter
Bubble: Democracy and Design,” Ethics and Information
Technology (17:4), pp. 249-265.
Bright, J. 2018. “Explaining the Emergence of Political Frag-
mentation on Social Media: The Role of Ideology and
Extremism,” Journal of Computer-Mediated Communication
(23:1), pp. 17-33.
Burt, R. S. 1992. Structural Holes: The Social Structure of
Competition, Boston: Harvard University Press.
Burton-Jones, A., Recker, J., Indulska, M., Green, P. F., and
Weber, R. 2017. “Assessing Representation Theory with a
Framework for Pursuing Success and Failure,” MIS Quarterly
(41:4), pp. 1307-1333.
Cooper, M. 2003. Media Ownership and Democracy in the Digital
Information Age, Center for Internet & Society, Stanford Law
School.
Dubois, E., and Blank, G. 2018. “The Echo Chamber Is Over-
stated: The Moderating Effect of Political Interest and Diverse
Media,” Information, Communication & Society (21:5), pp.
729-745.
Festinger, L. 1964. Conflict, Decision, and Dissonance (Vol. 3),
Stanford, CA: Stanford University Press.
Flaxman, S., Goel, S., and Rao, J. M. 2016. “Filter Bubbles, Echo
Chambers, and Online News Consumption,” Public Opinion
Quarterly (80:S1), pp. 298-320.
Fletcher, R., and Nielsen, R. K. 2016. “Is Social Media Use
Associated with More or Less Diverse News Use?,” November
25 (https://rasmuskleisnielsen.net/2016/11/25/is-social-media-
use-associated-with-more-or-less-diverse-news-use/; accessed
May 27, 2018).
Fletcher, R., and Nielsen, R. K. 2018a. “Are People Incidentally
Exposed to News on Social Media? A Comparative Analysis,”
New Media & Society (20:7), pp. 2450-2468.
Fletcher, R., and Nielsen, R. K. 2018b. “Automated Serendipity,”
Digital Journalism (6:8), pp. 976-989.
Fortunato, S., Flammini, A., Menczer, F., and Vespignani, A. 2006.
“Topical Interests and the Mitigation of Search Engine Bias,”
Proceedings of the National Academy of Sciences (103:34), pp.
12684-12689.
Freedman, D. A. 1999. “Ecological Inference and the Ecological
Fallacy,” International Encyclopedia of the Social & Behavioral
Sciences (6), pp. 4027-4030.
Frey, D. 1986. “Recent Research on Selective Exposure to Infor-
mation,” in Advances in Experimental Social Psychology (Vol.
19), L. Berkowitz (ed.), Cambridge, MA: Academic Press, pp.
41-80.
Gabszewicz, J. J., Laussel, D., and Sonnac, N. 2002. “Press Adver-
tising and the Political Differentiation of Newspapers,” Journal
of Public Economic Theory (4:3), pp. 317-334.
Garrett, R. K. 2009. “Echo Chambers Online? Politically Moti-
vated Selective Exposure among Internet News Users,” Journal
of Computer-Mediated Communication (14:2), pp. 265-285.
MIS Quarterly Vol. 44 No. 4/December 2020 1643
Kitchens et al./Echo Chambers and Filter Bubbles
Gentzkow, M., and Shapiro, J. M. 2011. “Ideological Segregation
Online and Offline,” The Quarterly Journal of Economics
(126:4), pp. 1799-1839.
Goel, S., Mason, W., and Watts, D. J. 2010. “Real and Perceived
Attitude Agreement in Social Networks,” Journal of Personality
and Social Psychology (99:4), pp. 611-621.
Gray, P. H., and Cooper, W. H. 2010. “Pursuing Failure,” Organi-
zational Research Methods (13:4), pp. 620-643.
Harrison, D. A., and Klein, K. J. 2007. “What’s the Difference?
Diversity Constructs as Separation, Variety, or Disparity in
Organizations,” Academy of Management Review (32:4), pp.
1199-1228.
Hart, W., Albarracín, D., Eagly, A. H., Brechan, I., Lindberg, M. J.,
and Merrill, L. 2009. “Feeling Validated Versus Being Correct:
A Meta-Analysis of Selective Exposure to Information,”
Psychological Bulletin (135:4), pp. 555-588.
Herlocker, J. L., Konstan, J. A., Terveen, L. G., and Riedl, J. T.
2004. “Evaluating Collaborative Filtering Recommender
Systems,” ACM Transactions on Information Systems (22:1), pp.
5-53.
Himelboim, I., McCreery, S., and Smith, M. 2013. “Birds of a
Feather Tweet Together: Integrating Network and Content
Analyses to Examine Cross-Ideology Exposure on Twitter,”
Journal of Computer-Mediated Communication (18:2), pp.
154-174.
Iyengar, S., Lelkes, Y., Levendusky, M., Malhotra, N., and
Westwood, S. J. 2019. “The Origins and Consequences of
Affective Polarization in the United States,” Annual Review of
Political Science (22), pp. 129-146.
Jacobson, S., Myung, E., and Johnson, S. L. 2016. “Open Media or
Echo Chamber: The Use of Links in Audience Discussions on
the Facebook Pages of Partisan News Organizations,” Infor-
mation, Communication & Society (19:7), pp. 875-891.
Janis, I. L. 1982. Groupthink: Psychological Studies of Policy
Decisions and Fiascoes (Vol. 349), Boston: Houghton Mifflin
Company.
Jehn, K. A., Northcraft, G. B., and Neale, M. A. 1999. “Why
Differences Make a Difference: A Field Study of Diversity,
Conflict and Performance in Workgroups,” Administrative
Science Quarterly (44:4), pp. 741-763.
Johnson, S. L., Gray, P., and Sarker, S. 2019. “Revisiting IS
Research Practice in the Era of Big Data,” Information and
Organization (29:1), pp. 41-56.
Jürgens, P., and Stark, B. 2017. “The Power of Default on Reddit:
A General Model to Measure the Influence of Information
Intermediaries: The Influence of Information Intermediaries,”
Policy & Internet (9:4), pp. 395-419.
Jurkowitz, M., Mitchell, A., Shearer, E., and Walker, M. 2020.
“U.S. Media Polarization and the 2020 Election: A Nation
Divided,” , January 24 (https://www.journalism.org/2020/01/24/
u-s-media-polarization-and-the-2020-election-a-nation-divided/).
Kaminskas, M., and Bridge, D. 2016. “Diversity, Serendipity,
Novelty, and Coverage: A Survey and Empirical Analysis of
Beyond-Accuracy Objectives in Recommender Systems,” ACM
Transactions on Interactive Intelligent Systems (7:1), pp. 1-42.
Klapper, J. T. 1960. The Effects of Mass Communication, Glencoe,
IL: Free Press.
Lawrence, E., Sides, J., and Farrell, H. 2010. “Self-Segregation or
Deliberation? Blog Readership, Participation, and Polarization
in American Politics,” Perspectives on Politics (8:1), pp.
141-157.
Lazer, D. 2015. “The Rise of the Social Algorithm,” Science
(348:6239), pp. 1090-1091.
Lazer, D. M. J., Baum, M. A., Benkler, Y., Berinsky, A. J.,
Greenhill, K. M., Menczer, F., Metzger, M. J., Nyhan, B.,
Pennycook, G., Rothschild, D., Schudson, M., Sloman, S. A.,
Sunstein, C. R., Thorson, E. A., Watts, D. J., and Zittrain, J. L.
2018. “The Science of Fake News,” Science (359:6380), pp.
1094-1096.
Li, K. G., Mithas, S., Zhang, Z., and Tam, K. Y. 2019. “How Does
Algorithmic Filtering Influence Attention Inequality on Social
Media?,” in Proceedings of the 40
th
International Conference on
Information Systems, Munich.
Lin, M., Lucas Jr., H. C., and Shmueli, G. 2013. “Research
Commentary—Too Big to Fail: Large Samples and the p-Value
Problem,” Information Systems Research (24:4), pp. 906-917.
McDonald, D., and Dimmick, J. 2003. “The Conceptualization and
Measurement of Diversity,” Communication Research (30:1), pp.
60-79.
Messing, S., and Westwood, S. J. 2014. “Selective Exposure in the
Age of Social Media: Endorsements Trump Partisan Source
Affiliation When Selecting News Online,” Communication
Research (41:8), pp. 1042-1063.
Mitchell, A., and Jurkowitz, D. 2014. “Social, Search & Direct:
Pathways to Digital News,” Pew Research Center (https://www.
journalism.org/2014/03/13/social-search-direct/).
Mutz, D. C. 2006. “How the Mass Media Divide Us,” in Red and
Blue Nation? Characteristics and Causes of America’s
Polarized Politics (Vol. 1), P. S. Nivola and D. W. Brady (eds.),
Washington, DC: Brookings Institution Press.
Mutz, D. C., and Martin, P. S. 2001. “Facilitating Communication
across Lines of Political Difference: The Role of Mass Media,”
American Political Science Review (95:1), pp. 97-114.
Negroponte, N. 1996. Being Digital, New York: Vintage Books.
Nickerson, R. S. 1998. “Confirmation Bias: A Ubiquitous
Phenomenon in Many Guises,” Review of General Psychology
(2:2), pp. 175-220.
Page, S. E. 2010. Diversity and Complexity (Vol. 2), Princeton, NJ:
Princeton University Press.
Pariser, E. 2011. The Filter Bubble: What the Internet Is Hiding
from You, New York: Penguin Press.
Prawesh, S., and Padmanabhan, B. 2011. “The ‘Top N’ News
Recommender: Count Distortion and Manipulation Resistance,”
in Proceedings of the 5
th
ACM Conference on Recommender
Systems, New York: ACM, pp. 237-244.
Schkade, D., Sunstein, C. R., and Hastie, R. 2007. “What Hap-
pened on Deliberation Day,” California Law Review (95), pp.
915-940.
Schmidt, A. L., Zollo, F., Vicario, M. D., Bessi, A., Scala, A.,
Caldarelli, G., Stanley, H. E., and Quattrociocchi, W. 2017.
“Anatomy of News Consumption on Facebook,” Proceedings of
the National Academy of Sciences (114:12), pp. 3035-3039.
Shore, J., Baek, J., and Dellarocas, C. 2018. “Network Structure
and Patterns of Information Diversity on Twitter,” MIS Quarterly
(42:3), pp. 849-872.
1644 MIS Quarterly Vol. 44 No. 4/December 2020
Kitchens et al./Echo Chambers and Filter Bubbles
Skjerdal, T., and Gebru, S. 2020. “Not Quite an Echo Chamber:
Ethnic Debate on Ethiopian Facebook Pages during Times of
Unrest,” Media, Culture & Society (42:3), pp. 365-379.
Sohn, M.-W. 2001. “Distance and Cosine Measures of Niche
Overlap,” Social Networks (23:2), pp. 141-165.
Stroud, N. J. 2010. “Polarization and Partisan Selective Exposure,”
Journal of Communication (60:3), pp. 556-576.
Sunstein, C. R. 2001. Republic.com, Princeton, NJ: Princeton
University Press.
Sunstein, C. R. 2002. “The Law of Group Polarization,” Journal
of Political Philosophy (10:2), pp. 175-195.
Sunstein, C. R. 2009. Going to Extremes: How Like Minds Unite
and Divide, New York: Oxford University Press.
Sunstein, C. R. 2017. # Republic: Divided Democracy in the Age
of Social Media, Princeton, NJ: Princeton University Press.
Vaidhyanathan, S. 2018. Antisocial Media: How Facebook Dis-
connects Us and Undermines Democracy, New York: Oxford
University Press.
Van Alstyne, M., and Brynjolfsson, E. 1996. “Could the Internet
Balkanize Science?,” Science (274:5292), pp. 1479-1480.
Van Alstyne, M., and Brynjolfsson, E. 2005. “Global Village or
Cyber-Balkans? Modeling and Measuring the Integration of
Electronic Communities,” Management Science (51:6), pp.
851-868.
Walker, M. 2019. “Americans Favor Mobile Devices over Desk-
tops and Laptops for Getting News,” Pew Research Center,
November 19 (https://www.pewresearch.org/fact-tank/2019/
11/19/americans-favor-mobile-devices-over-desktops-and-
laptops-for-getting-news/).
Weeks, B. E., Lane, D. S., Kim, D. H., Lee, S. S., and Kwak, N.
2017. “Incidental Exposure, Selective Exposure, and Political
Information Sharing: Integrating Online Exposure Patterns and
Expression on Social Media,” Journal of Computer-Mediated
Communication (22:6), pp. 363-379.
Welch, M. J., Cho, J., and Olston, C. 2011. “Search Result Diver-
sity for Informational Queries,” in Proceedings of the 20
th
International Conference on World Wide Web, pp. 237-246.
Wojcieszak, M. E., and Mutz, D. C. 2009. “Online Groups and
Political Discourse: Do Online Discussion Spaces Facilitate
Exposure to Political Disagreement?,” Journal of Communication
(59:1), pp. 40-56.
About the Authors
Brent Kitchens is an assistant professor at the University of
Virginia McIntire School of Commerce. He received his Ph.D. from
the University of Florida Warrington College of Business
Administration. His research interests include analytics of online
interactions, with a focus on applications for societal good and
public health. His research has been published at a variety of
outlets, including MIS Quarterly, Information Systems Research,
Journal of Management Information Systems, and IEEE Trans-
actions on Knowledge and Data Engineering.
Steven L. Johnson is an associate professor at the McIntire School
of Commerce, University of Virginia. He received his Ph.D. from
the Robert H. Smith School of Business, University of Maryland.
His research interests include online communities and other social
media that support open innovation with an emphasis on network
analysis. His research has appeared in outlets such as MIS
Quarterly, Organization Science, and Information Systems
Research.
Peter Gray is a professor at the University of Virginia’s McIntire
School of Commerce, where he teaches courses that connect ideas
about innovation, information technology, and strategic manage-
ment. His research focuses on the collaborative impacts of social
media, organizational networks, virtual teams, and online com-
munities. His research has been published in a range of leading
journals, including MIS Quarterly, Information Systems Research,
Management Science, Sloan Management Review, Organizational
Research Methods, California Management Review, the Journal of
Management Information Systems, Information & Organization, the
Journal of Strategic Information Systems, Information Technology
& People, and others.
MIS Quarterly Vol. 44 No. 4/December 2020 1645

Kitchens et al./Echo Chambers and Filter Bubbles
Appendix
Shore et al. (2018) identified the slant of 186 news URLs, which we used as the basis for multiple measures in this paper. Unless otherwise
noted, we used the scores they identify as is. However, because their unit of analysis was a URL associated with a Twitter account, there were
certain necessary exceptions or deviations from their list as described in Table A1. First, a small number of the URLs they identified contained
both a domain and a path or page (e.g., buzzfeed.com/news). In order to cleanly identify direct versus other visits, for these sites we either
removed the path and used only the domain, or removed the entry from the list if the domain was already included on the list with a different
slant score. Another small subset of sites either functioned as more than just a news site (aol.com, reddit.com) or were simply a sub-site of a
portal or social media outlet (facebook.com/cnsnewscom, news.yahoo.com). Again, in order to avoid bias and conflation in our measures, these
sites were omitted. All URLs not listed in Table A1 were included as is.
Table A1. Changes in URL Inclusion Compared to Shore et al. (2018)
URL Issue/Resolution
cnn.com/politics
Includes path. This entry omitted. Separate no-path entry retained.
huffingtonpost.com/black-voices/
huffingtonpost.com/politics
rollingstone.com/politics
wsj.com/opinion
buzzfeed.com/news
Includes path. This entry used with path removed.
cbc.ca/news/
nature.com/news
pbs.org/newshour
pewresearch.org/fact-tank
pjmedia.com/instapundit/
membership.politifact.com Includes nonrelevant subdomain. Entry used without subdomain.
aol.com General site containing more than news. Removed.
facebook.com/cnsnewscom Facebook page, not news site. Removed.
finance.yahoo.com
news.msn.com Subdomain of search/portal site. Removed.
news.yahoo.com
reddit.com Social media site. Removed from news site list
1646 MIS Quarterly Vol. 44 No. 4/December 2020

Kitchens et al./Echo Chambers and Filter Bubbles
Table A2. Correlations (1,092,480 User-Periods over 185,548 Users)
Distinct News Sites
Slant Dispersion
Audience Variety
Reverse Gini
Slant
Cross-Cutting
Direct News Visits
Search Referrals
Email Referrals
Facebook Referrals
Reddit Referrals
Twitter Referrals
Time on Search
Time on Email
Time on Facebook
Time on Reddit
Time on Twitter
Slant Dispersion 0.49
Audience Variety 0.50 0.62
Reverse Gini 0.64 0.46 0.78
Slant 0.07 0.29 0.05 0.06
Cross-Cutting 0.04 0.16 0.07 0.01 -0.06
Direct News Visits 0.30 0.07 0.09 0.21 0.09 -0.02
Search Referrals 0.52 0.19 0.24 0.33 0.00 0.01 0.15
Email Referrals 0.17 0.06 0.07 0.14 0.02 0.00 0.11 0.12
Facebook Referrals 0.36 0.18 0.15 0.24 0.04 0.01 0.10 0.15 0.13
Reddit Referrals 0.21 0.05 0.06 0.07 -0.02 -0.01 0.01 0.04 0.00 0.04
Twitter Referrals 0.17 0.04 0.04 0.08 0.00 0.00 0.06 0.09 0.07 0.11 0.02
Time on Search 0.18 0.11 0.14 0.15 0.01 0.02 0.04 0.18 0.10 0.06 0.00 0.02
Time on Email 0.12 0.09 0.11 0.12 0.02 0.02 0.04 0.08 0.17 0.05 0.00 0.01 0.60
Time on Facebook 0.13 0.14 0.13 0.12 0.02 0.05 0.00 0.05 0.01 0.25 0.01 0.02 0.08 0.06
Time on Reddit 0.14 0.05 0.06 0.06 -0.02 -0.01 0.00 0.02 0.00 0.02 0.54 0.01 0.00 -0.01 0.01
Time on Twitter 0.06 0.02 0.04 0.04 -0.01 0.00 0.00 0.04 0.00 0.02 0.01 0.20 0.02 0.00 0.06 0.02
Time Online 0.26 0.17 0.22 0.26 0.01 0.04 0.10 0.16 0.09 0.13 0.04 0.04 0.44 0.39 0.35 0.05 0.09
MIS Quarterly Vol. 44 No. 4/December 2020 1647

Kitchens et al./Echo Chambers and Filter Bubbles
Table A3. Summary Statistics for Users on Panel for at Least 365 Days Across all 4-Week User-Periods
Including > 0 News Visits (1,092,480 User-Periods over 185,548 Users)
All Users
Liberal Tercile
(Users with all-time mean
slant < -10.45)
Centrist Tercile
(Users with all-time mean
slant b/w -10.45 and -3.16)
Conservative Tercile
(Users with all time mean
slant > -3.16)
Median Mean SD Median Mean SD Median Mean SD Median Mean SD
Distinct news sites 2 2.97 3.80 2 2.94 3.81 2 2.90 3.28 2 3.09 4.35
Diversity - Slant dispersion 1.02 6.53 10.46 0.79 5.07 7.93 1.30 5.55 8.75 0.98 9.24 13.66
Diversity - Audience variety 63.09 42.95 40.62 60.84 41.73 40.56 65.10 43.96 39.92 62.64 42.95 41.50
Diversity - Reverse Gini 6.30 19.66 23.35 3.48 19.59 23.65 10.00 19.78 22.56 3.67 19.59 23.98
Slant -7.58 -4.35 20.75 -16.03 -15.36 11.16 -7.58 -7.03 11.70 -0.44 10.12 27.59
Cross-cutting 0.00 8.59 23.78 0.00 3.87 14.32 N/A 0.00 23.97 35.76
Direct news visits 0 3.26 29.28 0 2.26 20.09 0 2.26 17.34 0 5.51 44.68
Search referrals 0 1.08 3.10 0 0.97 2.74 0 1.20 2.99 0 1.03 3.55
Email referrals 0 0.11 1.18 0 0.15 1.40 0 0.08 1.01 0 0.12 1.14
Facebook referrals 0 0.45 2.40 0 0.58 2.67 0 0.31 1.50 0 0.50 2.94
Reddit referrals 0 0.03 0.55 0 0.07 0.84 0 0.03 0.45 0 0.01 0.20
Twitter referrals 0 0.02 0.33 0 0.02 0.38 0 0.01 0.23 0 0.01 0.38
Time on search 1.56 4.19 10.36 1.36 3.61 9.48 1.81 4.59 10.87 1.49 4.29 10.56
Time on email 0.40 2.61 7.89 0.38 2.39 7.31 0.45 2.68 8.09 0.36 2.74 8.19
Time on Facebook 0.57 4.74 10.78 0.66 4.60 10.22 0.52 4.52 10.41 0.54 5.15 11.74
Time on Reddit 0.00 0.09 1.25 0.00 0.19 1.91 0.00 0.07 0.97 0.00 0.02 0.44
Time on Twitter 0.00 0.13 1.39 0.00 0.14 1.22 0.00 0.16 1.53 0.00 0.09 1.38
Time online 28.91 46.44 57.30 27.18 44.18 54.38 30.80 48.15 57.66 28.38 46.62 59.60
Measures per user
Age 33 36.94 15.35 32 35.69 15.08 33 36.16 14.84 37 38.98 15.91
Gender 51.55% male 47.39% male 53.60% male 53.65% male
1648 MIS Quarterly Vol. 44 No. 4/December 2020
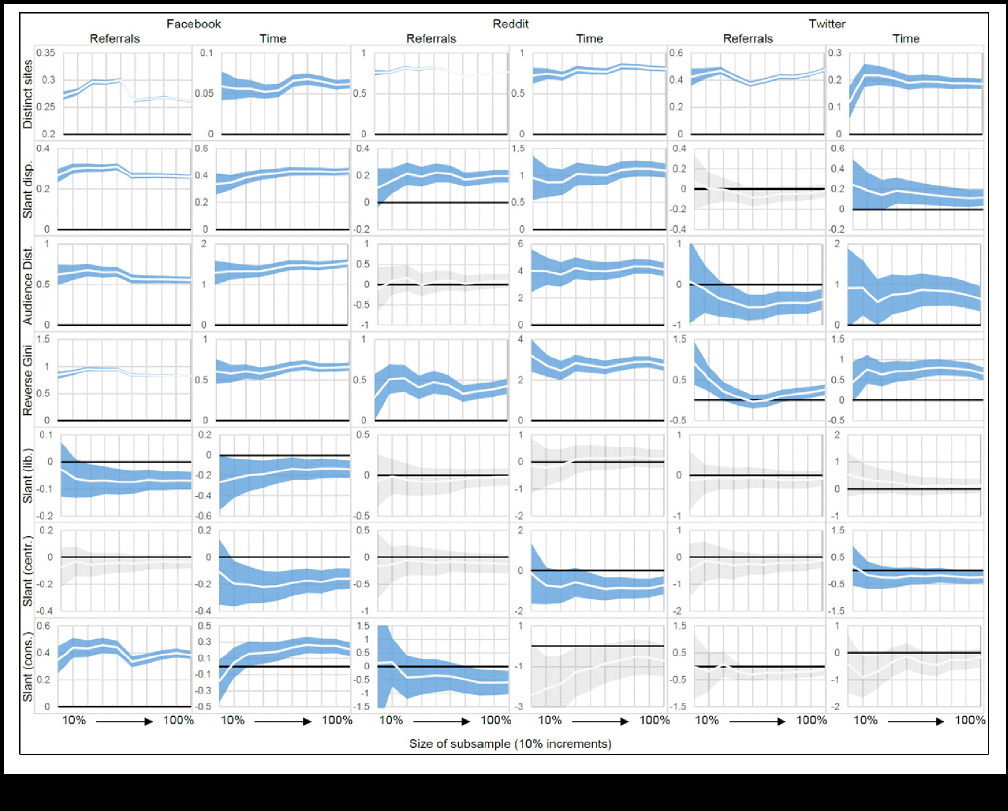
Kitchens et al./Echo Chambers and Filter Bubbles
Figure A1. 95% CI Plots for Coefficients Estimated Using Random Subsamples
MIS Quarterly Vol. 44 No. 4/December 2020 1649
1650 MIS Quarterly Vol. 44 No. 4/December 2020
